Mission 3 - ABCXYZ Revisited
Estimated time for completing this mission: 20 mins
Learning Objective
Revisiting ABCXYZ with better visualization and in a more interactive way. One can learn how to develop the user interface part of the app.
Scenario
Creating apps where users have more control over the parameters can result in deeper analysis. Hence, creating apps with a better user interface is vital.
BLOX used in this mission:
Logic BLOX
- MyData/FinalData
- Business/ABC Analyses
- Business/XYZ Analyses
- Business/ABCXYZ Analyses
App BLOX
- Chart
- Panel
- Input (5x)
- Button
- Textfield (5x)
Data
The same data set will be used as for the previous exercise. In case you do not have the data set you can download it here: FinalData.xlsx
Steps
Please refer to the Navigation Guide to perform the steps below
App Designer:
ABCXYZ evolved
- Import dataset from Data section to Module4 folder
- In Module4 create new app named ABCXYZ Revisited
- Include all the BLOX which are mentioned in the description above as App BLOX
- Make the "panel" BLOX large enough to fit the "chart" BLOX in it
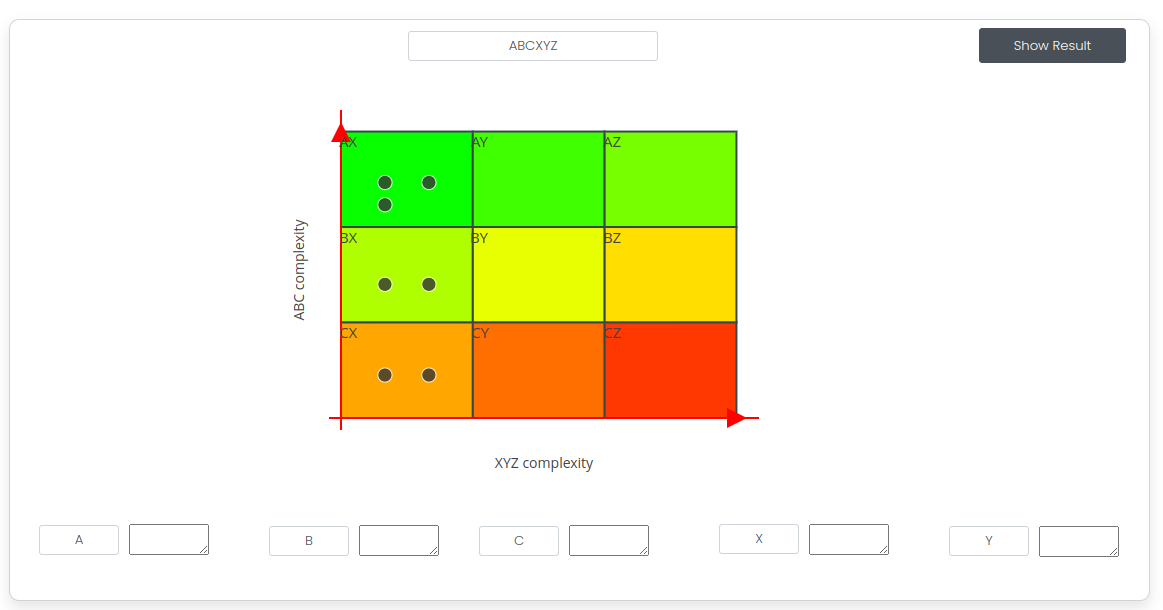
- In the "input" BLOX write a title for the dashboard/data set, like ABCXYZ as shown in the Figure Layout composition below
-
Once the layout of the app is done (See the figure below for help), click on the flask icon on your current page to add logics for this page
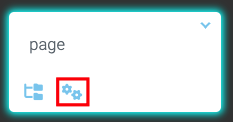
-
This will open a new logic behind the layout, lets call it "ABCXYZ"
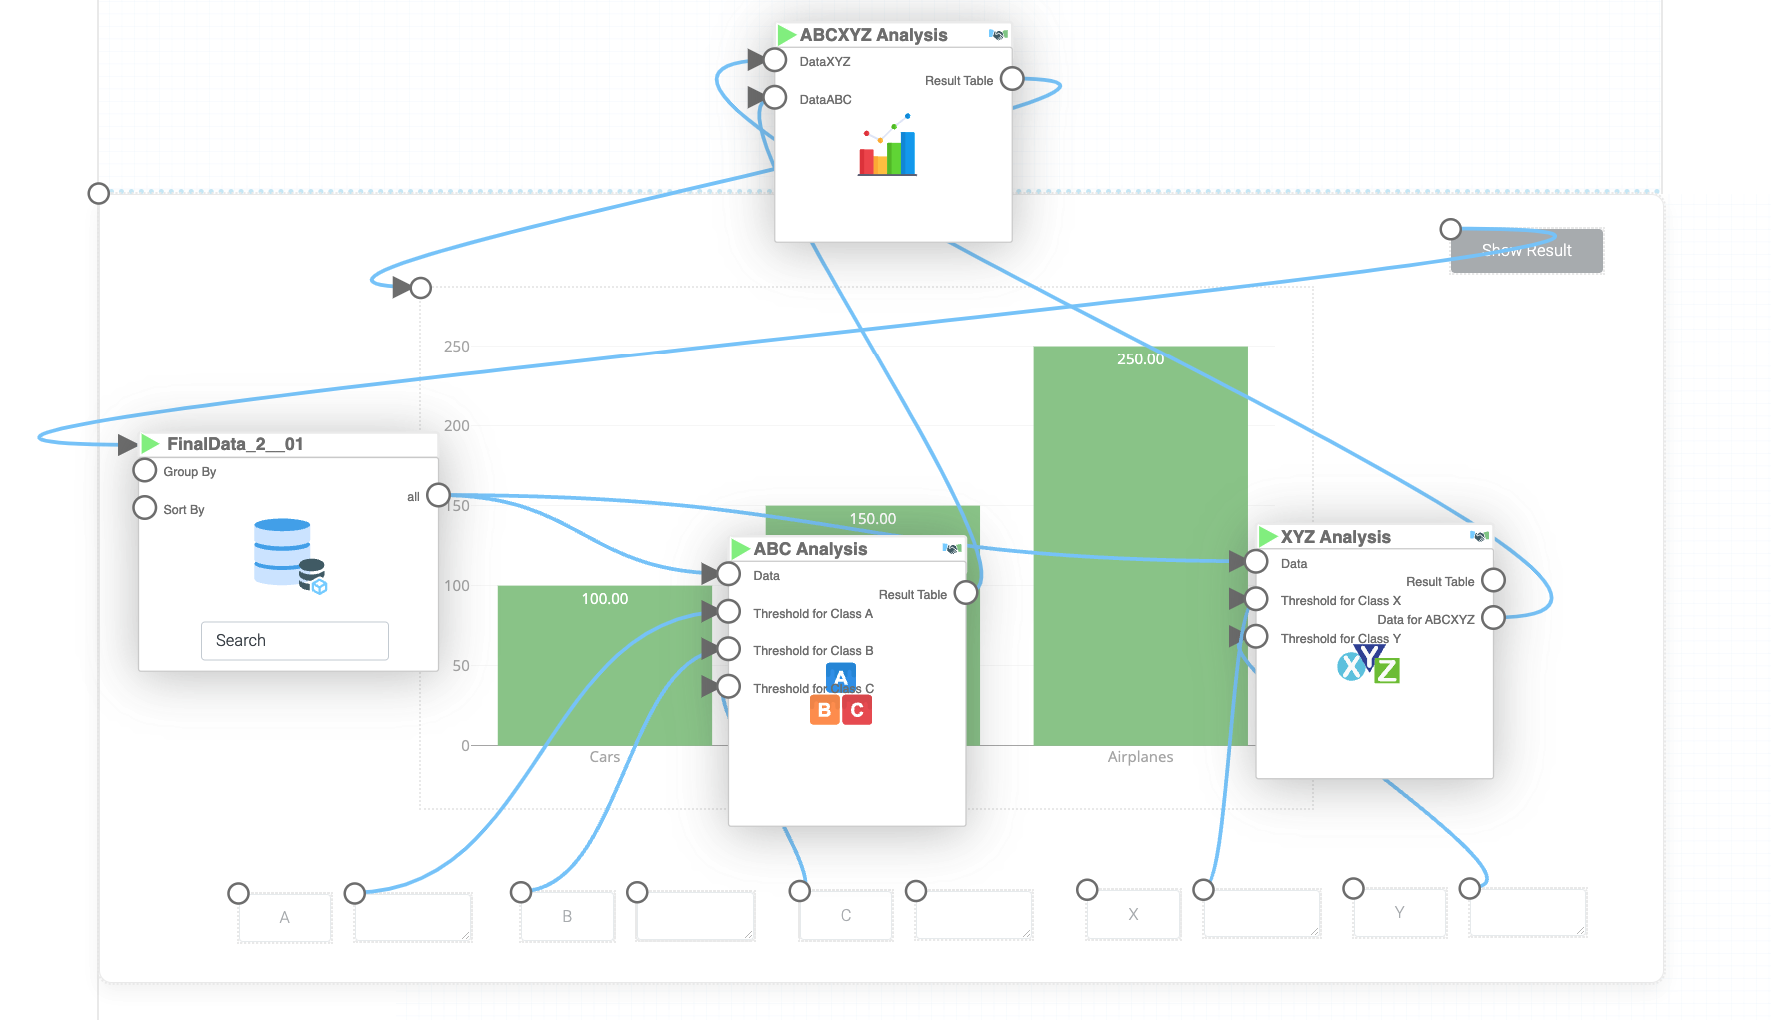
- Drop the data into the App Designer and connect the "button" page BLOX to it (make sure to connect it to the green play button rather than the green circle)
- Connect the "MyData" BLOX output to a "ABC" and an "XZY" analyses chart
- For both BLOX, at the input tab, make all the possible inputs visible and connect them as it can be seen in the image at the result section
- At "ABC" specify "PRODUCTLINE" as item and "SALES" as numeric whereas for "XYZ" specify period as "6 month", time bucket as "1 month", timestamp as "ORDERDATE", items as "PRODUCTLINE" and quantity as "QUANTITYORDERED"
- The last BLOX is missing, and it is your task to figure it out which, and how to connect it to the previous bloxes and to the Page components (remember, the goal is to output the ABCXYZ analyses chart)
Hint
From XYZ connect the ABCXYZ output to a "ABCXYZ analyses" BLOX and from the ABC connect the result to the same "ABCXYZ analyses" BLOX. Specify "Product List" as PRODUCTLINE and "Profits List" as SALES. Then connect the result from the "ABCXYZ analyses" BLOX (ideally the cluster chart but feel free to try out the others) to the top left corner of the "Chart" page BLOX.13. Then run the app and once the "Button" page BLOX is pressed, you can see the resulting chart

Results and Summary