Mission 2 - KPI Dashboard (continued)
Estimated time for completing this mission: 20 mins
Learning Objective
The dashboard you built in the previous mission serves as a good base for more complex dashboards. You learned about the concept of binding app blox to data sources, which will again be used in this mission for a slightly different purpose.
What if you want to apply complicated logic to the data before it is visualized? Or compute certain KPIs for a given data source and visualize them in a dashboard?
In other words, it is important to combine your previously learned skills with the ability to create your own logics and merge them with the LOGIBLOX app designer. The learning objective of this mission is to learn how to use the Flow Builder to create logics, which can then be used as artificial data sources in the your apps.
Scenario
Let's assume you're not happy with having a purely visual dashboard, such as the one you just created. You'd much rather see KPI numbers at a glance - for example for a given combination of filters (State/City/Category/Sub-Category/Time Period) what are the:
- Total Sales?
- Total Profit?
- Sold Units?
- ...
Data
Import this prepared LOGIBLOX project: Module 4 - Mission 2.lbx into your module three folder or home directory.
This project contains a data source called Sales Data as well as the dashboard you created in the previous mission and a logic. Instead of using the sub-set of the sales data, we will now use the complete dataset.
Note
You can also import the data from the templates. Click Plus / From Example / Sales Data
Your screen should look somewhat like this after importing the project. The model solution is already included in the project as well. You can use it to compare your solution to ours.

Goal
Goal
Enjoy with headphones. (Turn on the sound using the in-video volume controls.)
Steps
This task consists of two steps. The first one is to build a logic in the Flow Builder that computes the KPIs. The second step is to use the logic as a data source in the dashboard you created in the previous mission.
There are three tasks outlined in the template. Carefully read through the instruction in the Sticky Notes Blox. Follow these steps to complete the mission. Start with the line chart, then the tree map and finally the data filters.
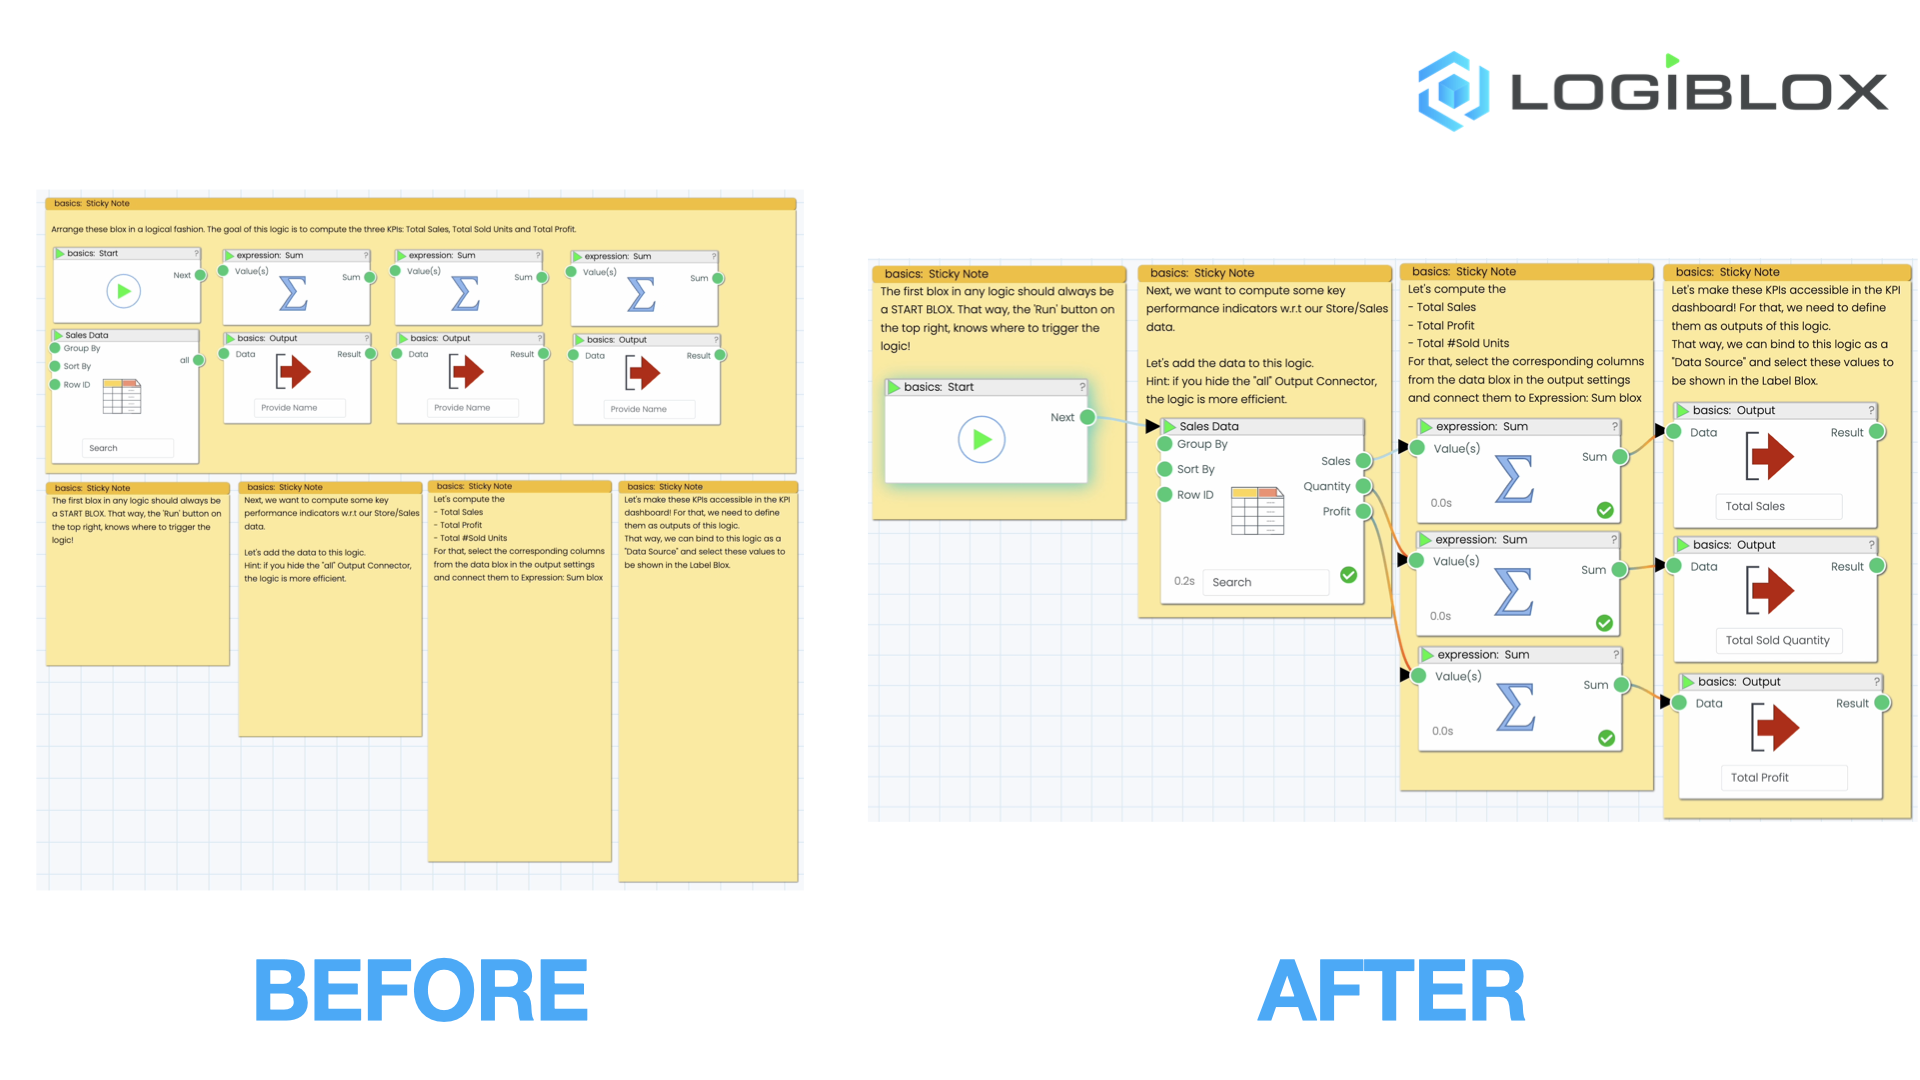
Task 1: Compute KPIs Logic
Open the logic: Compute KPIs (Template) in the Flow Builder. You'll find several blox arranged on the canvas. The blox are not yet connected or in order. Your task is to carefully read through the documentation and hints on the sticky notes and construct a logical flow from these blox.
If necessary you can also use the Compute KPIs (Solution) logic as a reference. Take care to connect the correct input & output connectors and to provide all required settings.
Task 2: Use a Logic as Data Source in Dashboard
Back in the App Designer, you can now bind the outputs of the logic to the labels in the colored panels.
Just double click on the empty label, i.e. below the Total Sales ($) label. Set the Bind to Data Source setting to Compute KPIs (Template) and select the Total Sales column. Repeat this for the other labels.
If you run the app now, you should see the KPIs being updated as you change the filters. This works, because all the elements in the app are bound to the same data source - either directly or indirectly via the logic.
This is a very powerful concept, because it allows you to create complex logics and use them as data sources in your apps.