Mission 11 - Core Analytics
Estimated time for completing this mission: 10 mins
Learning Objective
Learning a simple way to get statistical data from a numerical column.
Scenario
Definitely you had to calculate things like mean, median or variance many times. That is also within the range of LOGIBLOX possibilities. It is really easy. Just provide the appropriate BLOX with numerical column, and the result will be displayed inside the corresponding BLOX!
BLOX used in this mission
- Basics/Start
- MyData/data_with_suppliers.xlsx
- Statistic/Mean
- Statistic/Median
- Statistic/Standard Deviation (Own Mission)
- Statistic/Variance
- Statistic/Quantile (Own Mission)
Data
In this mission we will use the prepared dataset from the previous section.
If you can not create it, here is a link for the dataset data_with_suppliers.xlsx
Steps
Please refer to the Navigation Guide to perform the steps below
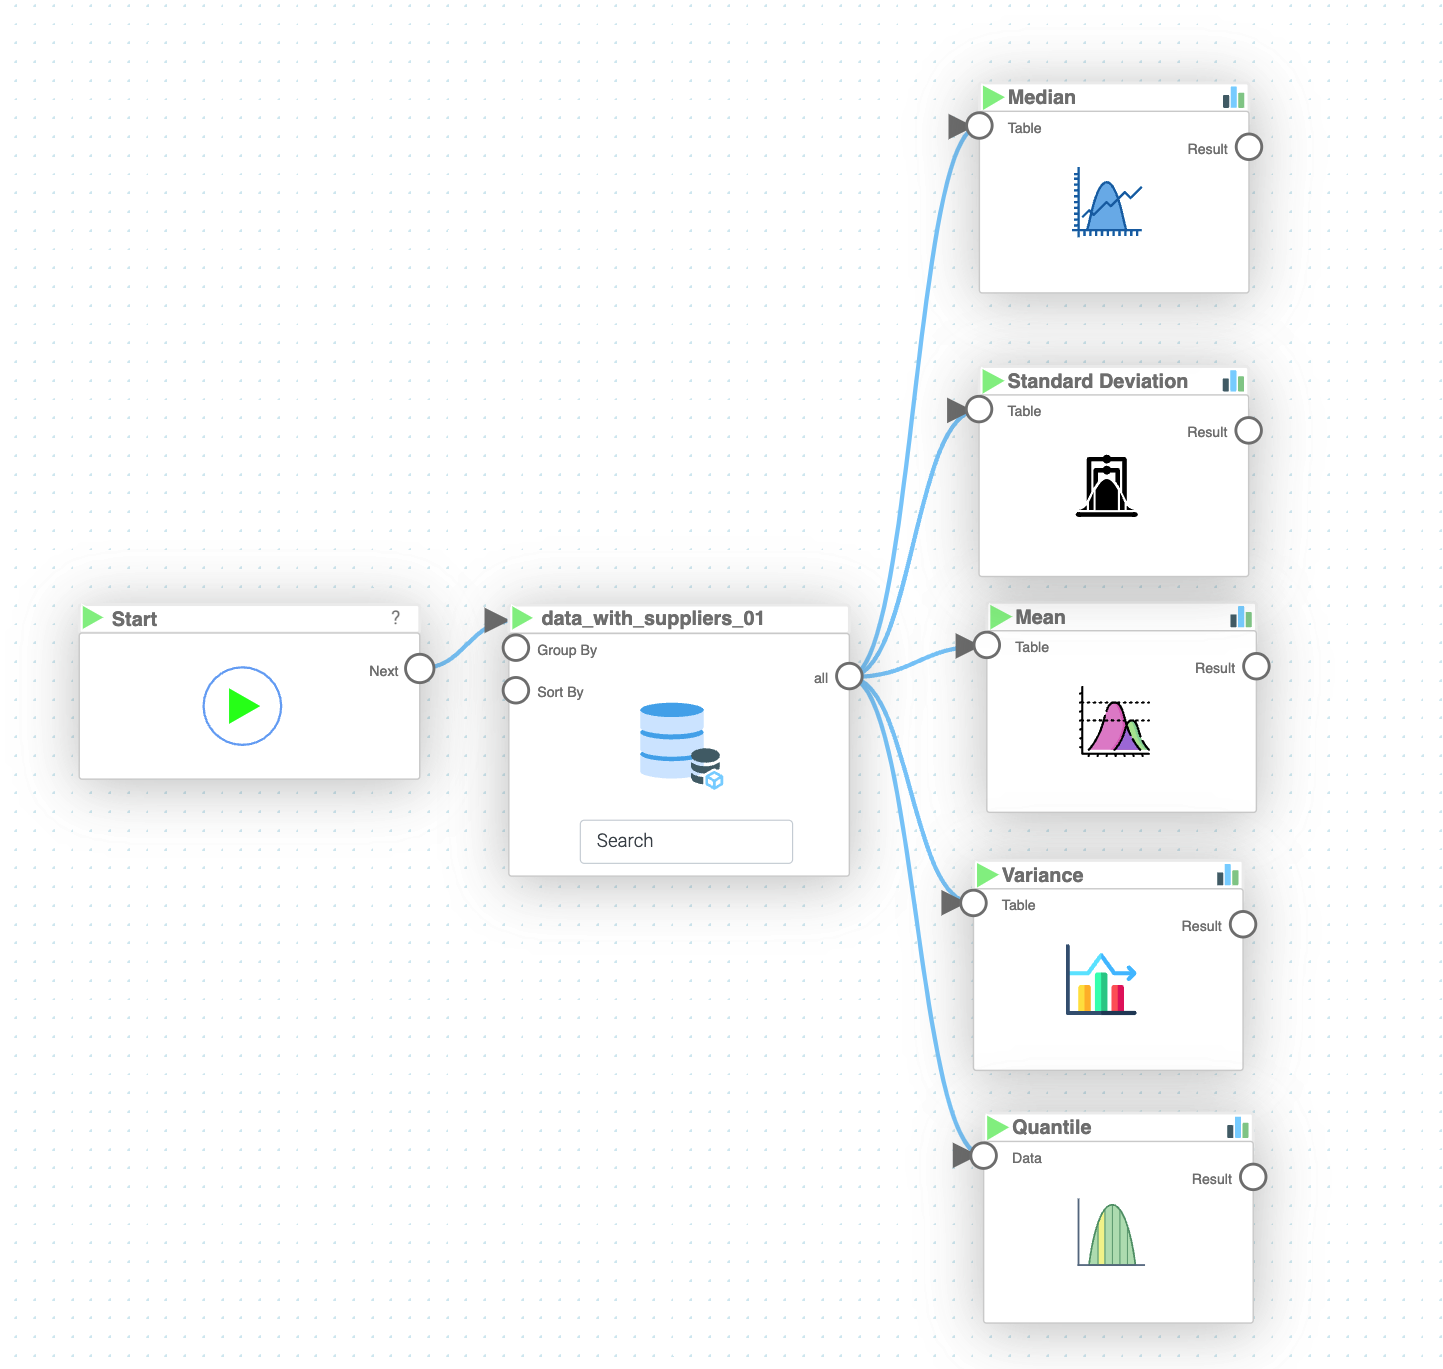
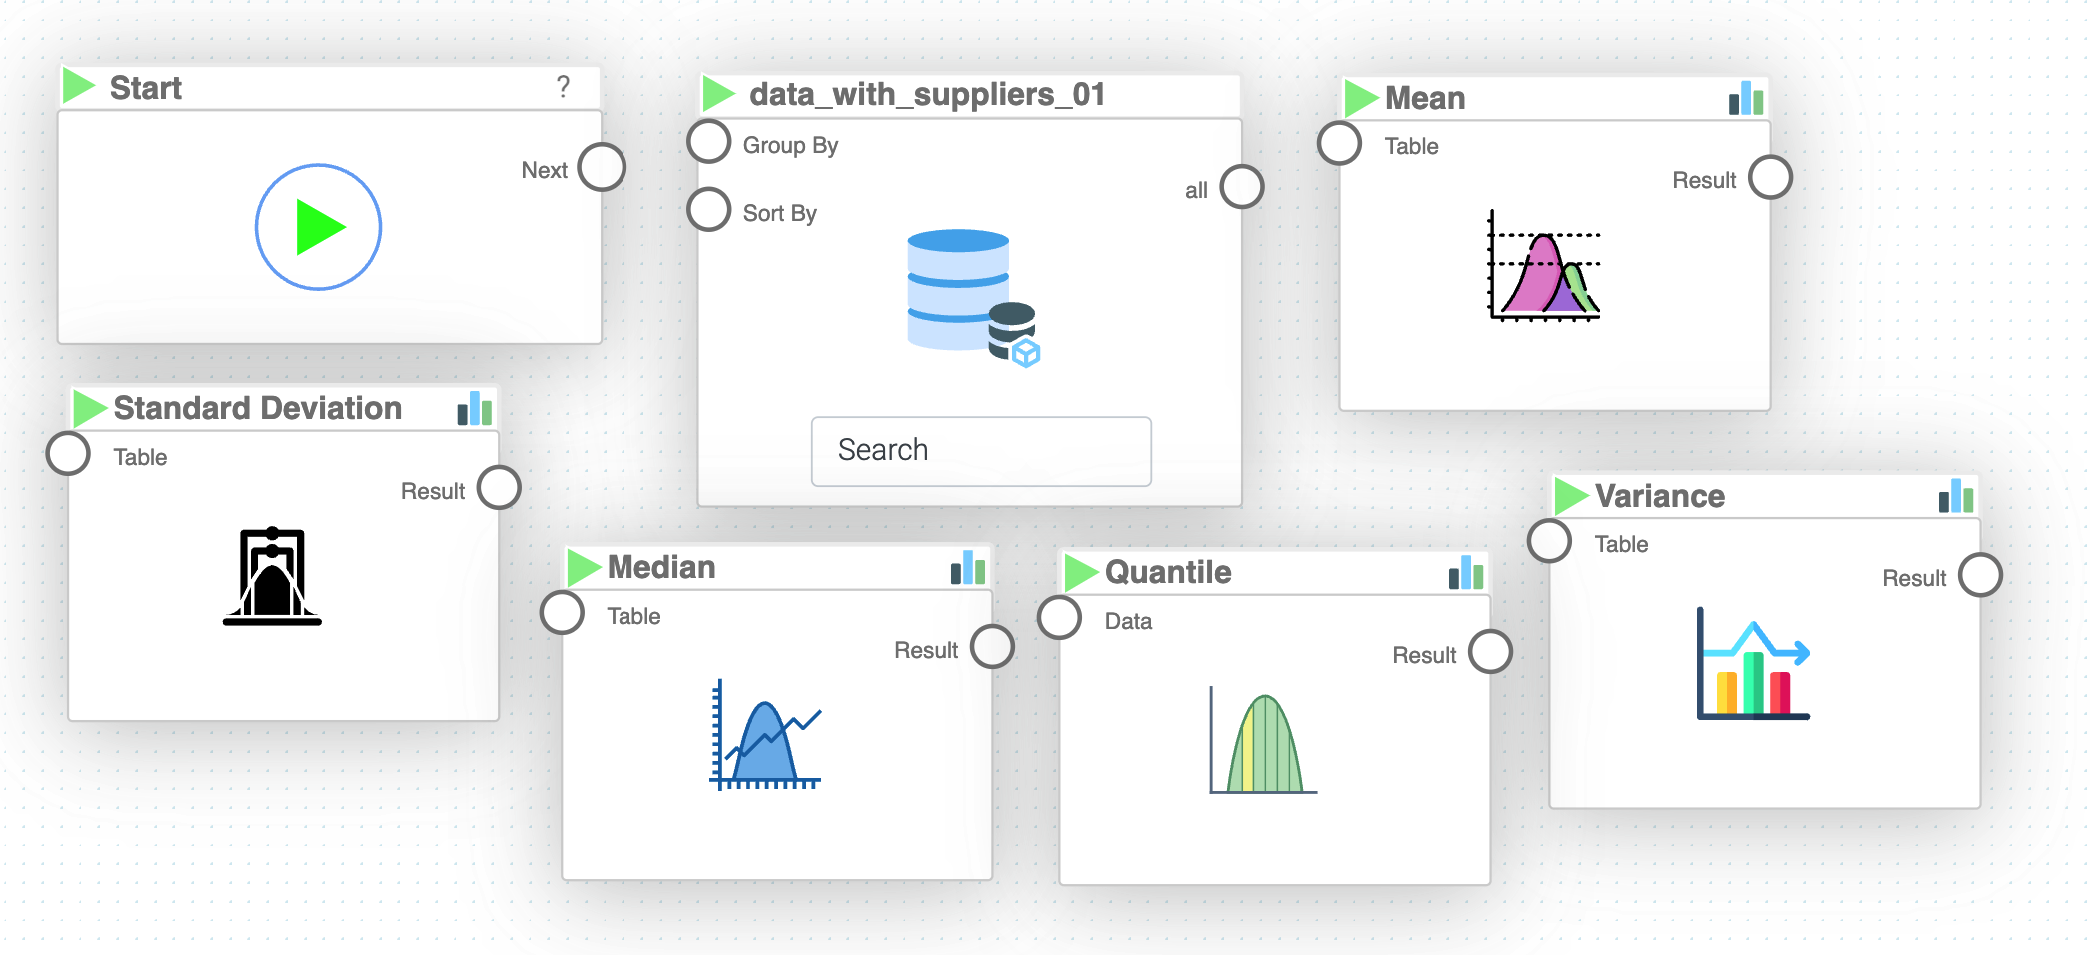
- In the Flow Builder, drag-and-drop all the necessary BLOX listed above
- Start with "Start" BLOX and connect it to the "MyData" BLOX
- Now you can connect the output from the "MyData" BLOX to all of the remaining BLOX (select "Amount")
- In the sidebars of all statistics BLOX select the numerical column name
- Press play and wait for the green ticks to appear on the BLOX
- If you want to see the results, double click the statistics BLOX
Tip
For more advanced users it is possible to check if the normality assumptions hold for a certain dataset! As a challenge, try to figure out which BLOX it could be and apply it.
Hint
It is the "Distribution" function from the Statistics tab. Connect a column which you would like to check the normality assumption on. Explore all three result tabs!
Results and Summary
Now you will be provided with all the statistical information about the numerical column you have provided.