Mission 3: IoT Dashboard App
Estimated time: 30 minutes
Learning Objective
Learn how to build an interactive dashboard application to monitor and manage your IoT devices in real time. This mission covers creating input controls for device properties and visualizing live sensor data with charts.
Prerequisites
Refer to the Navigation Guide to familiarize yourself with the platform interface before starting this mission.
App Templates Used in This Mission
- Input
- Label
- Chart (x2)
Materials
- Module 7.lbx — Solution file containing the completed IoT Dashboard app
Step-by-Step Instructions
1. Create the Dashboard App
- Navigate to the "Module 7" project folder
- Click Add Item → Create App
- Name your app "IoT Dashboard"
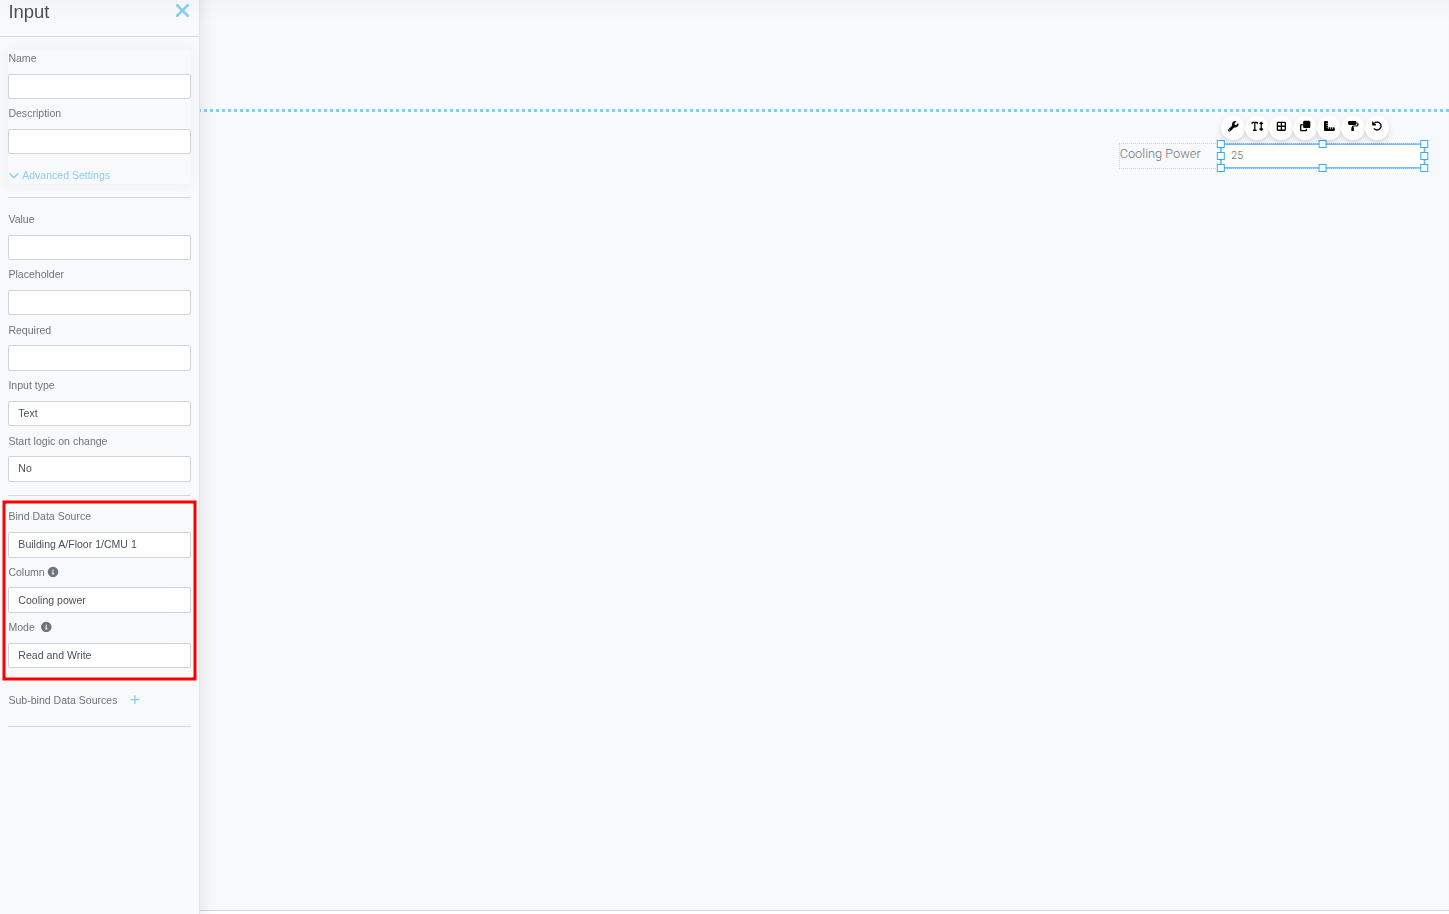
2. Add Device Property Controls
- Place an Input template and a Label template on the page
- Set the Label text to the property name you want to manage (e.g., "Cooling Power")
- Double-click the Input template to open its advanced settings
- Configure the Input binding:
- Data Source: Select your device
- Column: Select the property you want to manage
- Mode: Set to "Read and Write"
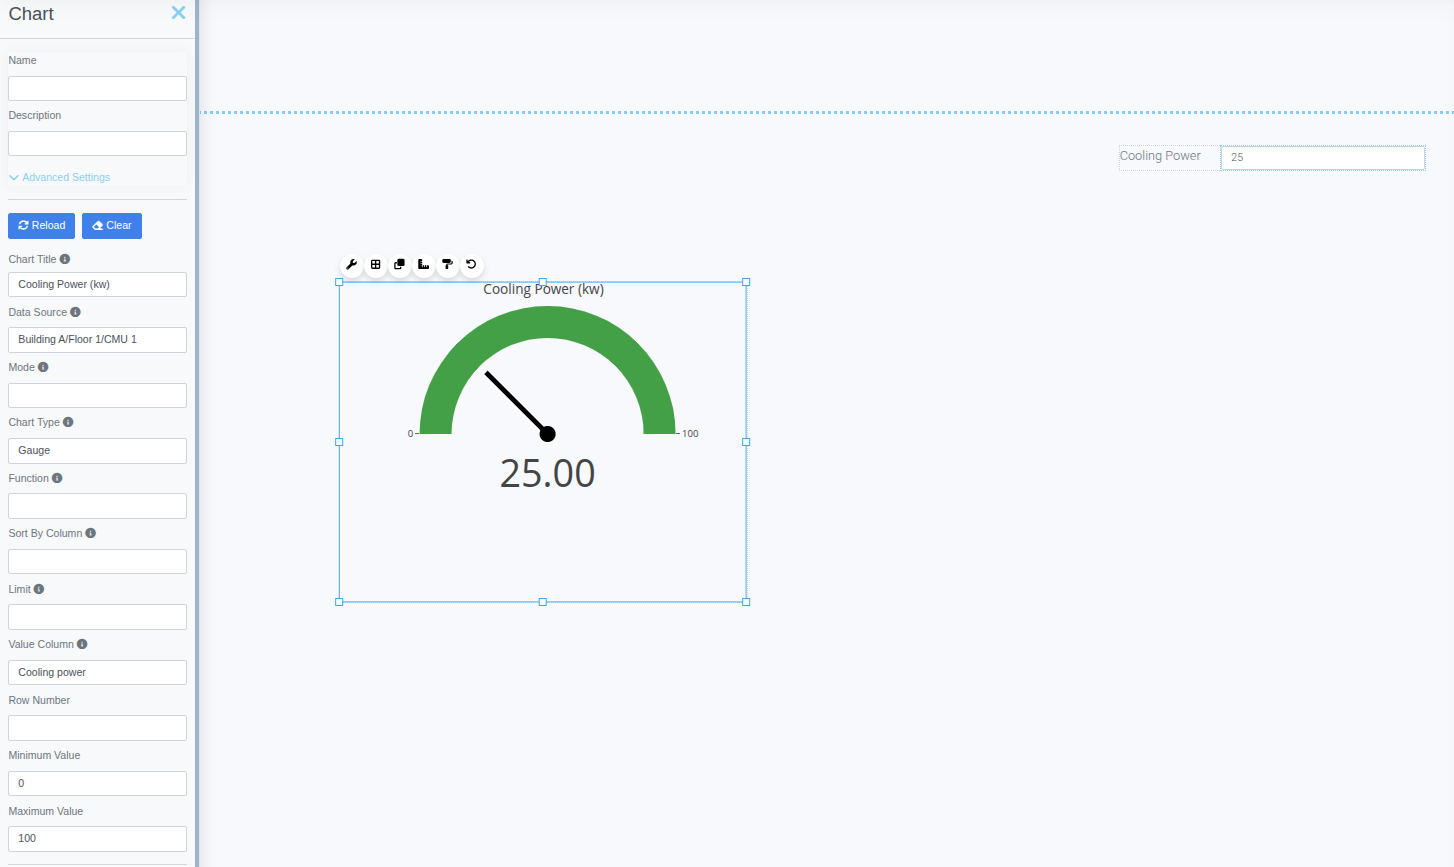
3. Add a Gauge Chart
- Place a Chart template on the page
- Configure the chart settings:
- Data Source: Select your device
- Type: Gauge
- Value Column: Select the property to monitor
- Min/Max: Set appropriate minimum and maximum values
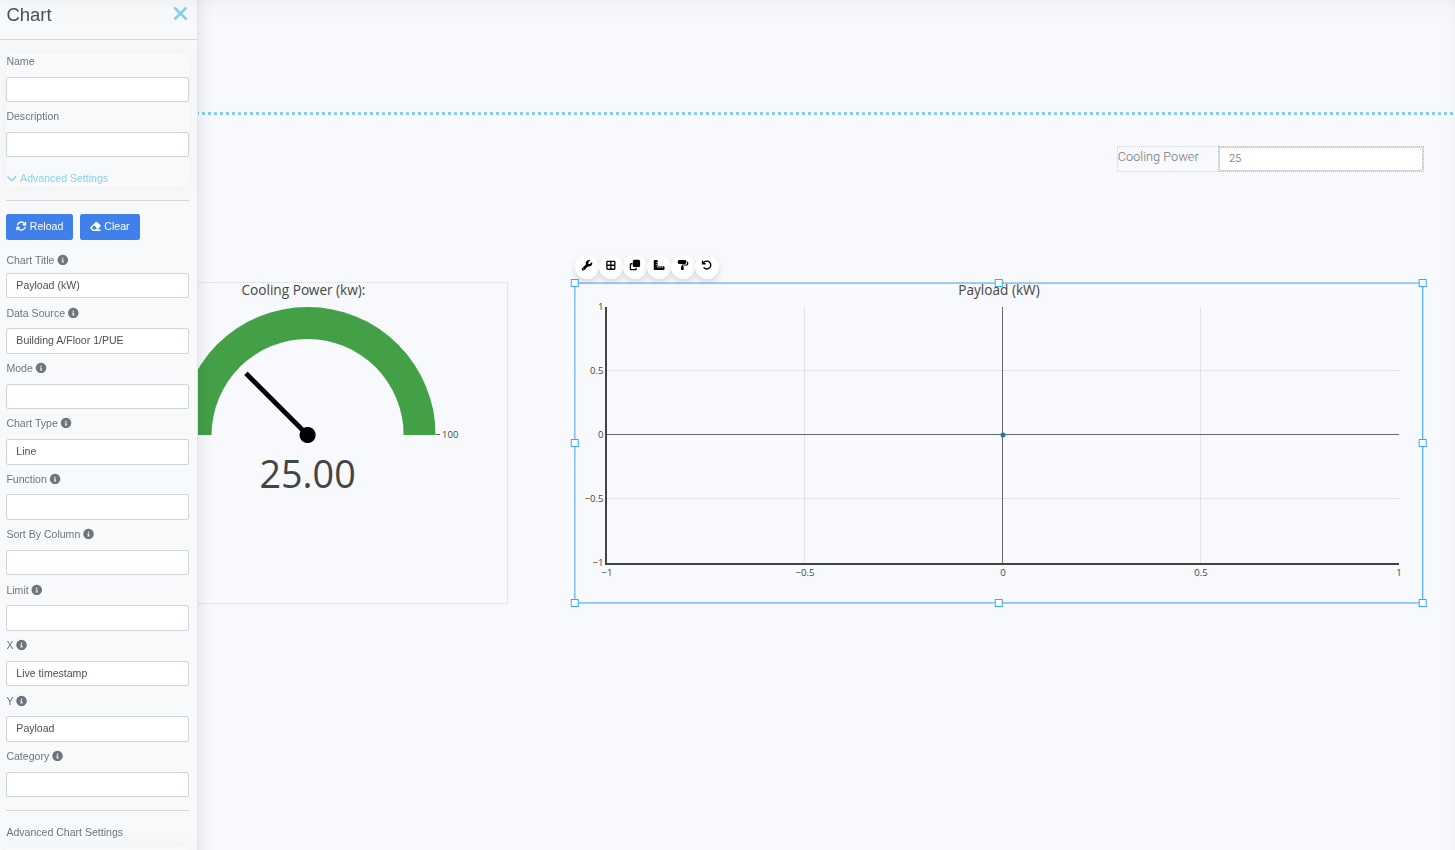
4. Add a Live Time-Series Chart
- Place another Chart template on the page
- Configure the chart settings:
- Data Source: Select your device
- Type: Line
- X: Live timestamp
- Y: Select the property to monitor
5. Test the Dashboard
- Click the Run button to enter test mode
- Use the Input field to edit device property values
- Observe the Gauge chart updating with current values
- Watch the Line chart display live data over time
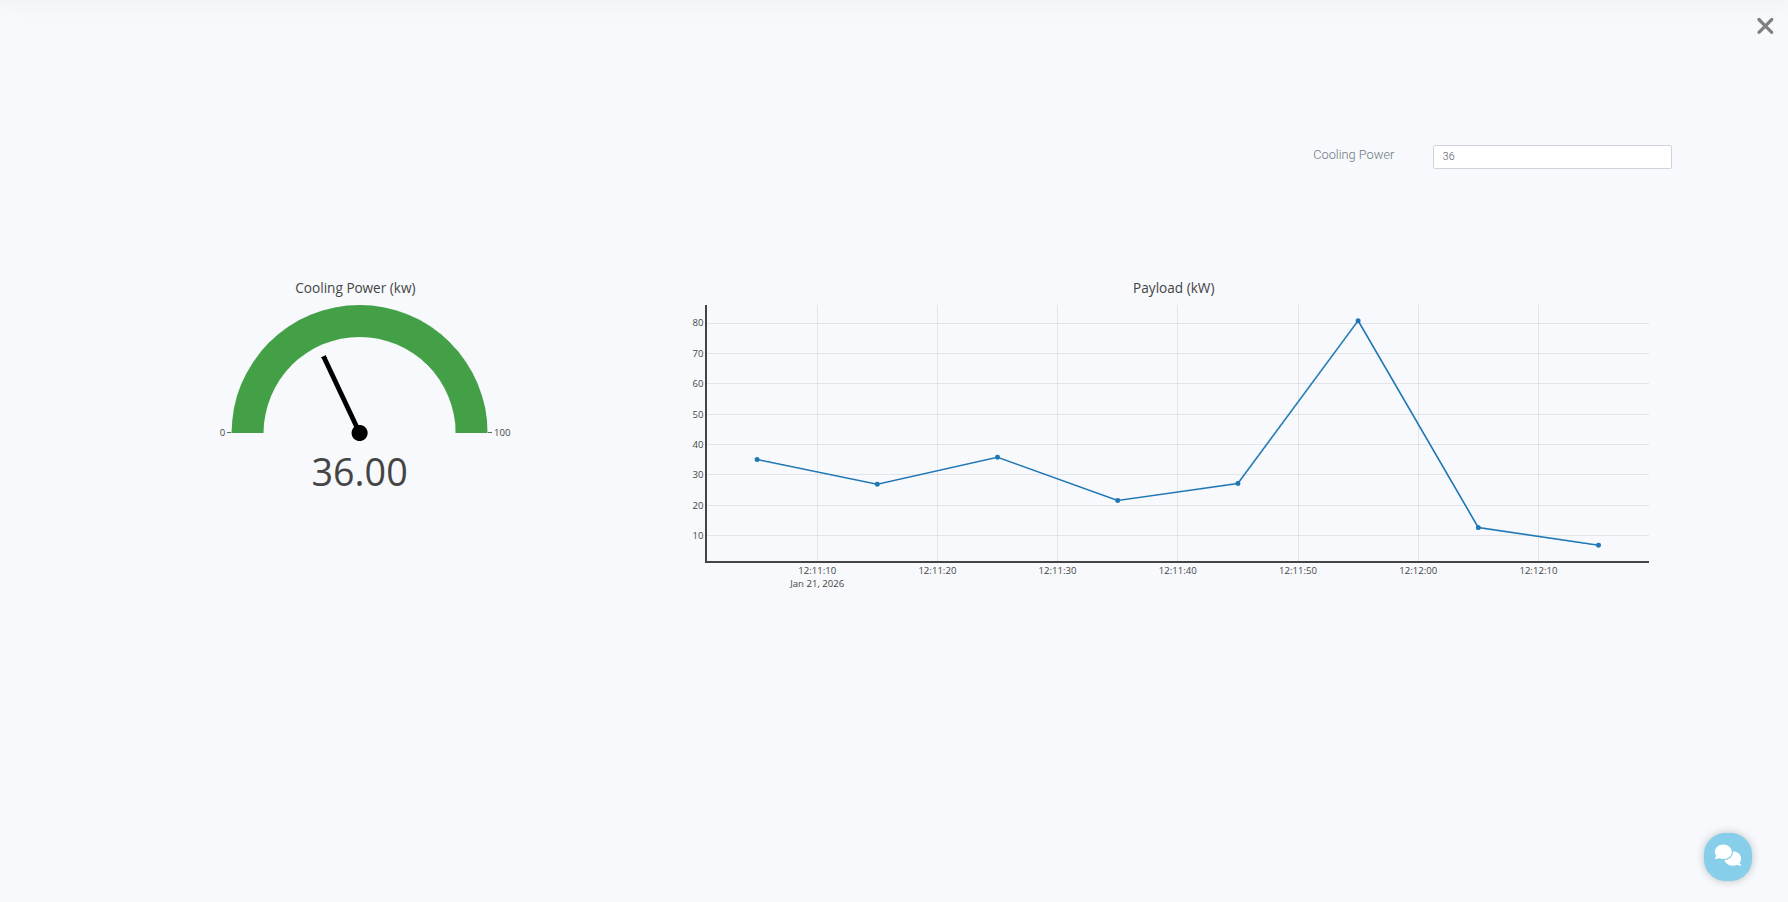
Real-Time Updates
The dashboard automatically refreshes to display the latest device data without manual intervention.
Summary
You've successfully learned how to:
✓ Create a dashboard app for IoT device management
✓ Bind Input controls to device properties for read/write operations
✓ Configure Gauge charts to display current property values
✓ Set up Line charts for live time-series monitoring
✓ Test and interact with your IoT dashboard in real time
Congratulations! You've completed Module 7: IoT Integration.