Mission 13 - Comparing Predictions
Estimated time for completing this mission: 30 mins
Learning Objective
Creating charts with advanced functionality in App Designer.
BLOX used in this mission:
Logic BLOX
- MyData/FinalData
- AI/Regression Model
- AI/Time Series Model
App Templates
- Chart (2x)
- Panel
- Button (2x)
- Label (4x)
- Multiselect (2x)
Data
The same data set will be used as for the previous exercise. In case you do not have the data set you can download it here: FinalData.xlsx
Steps
Please refer to the Navigation Guide to perform the steps below
App Designer:
Create Comparing Predictions App
- Import the dataset from the Data section to Module5 folder
- In Module5, create a new app named Comparing Predictions
- Drag a Panel template onto the canvas and make it large enough to fit the content
- Drag two Chart templates into the Panel side by side
- Add two Multiselect templates above the charts for selecting feature variables
- Add four Label templates to display model information and accuracy scores
- Add two Button templates to trigger each model's logic
- Click the flask icon to create a new logic flow and name it "Compare Models"

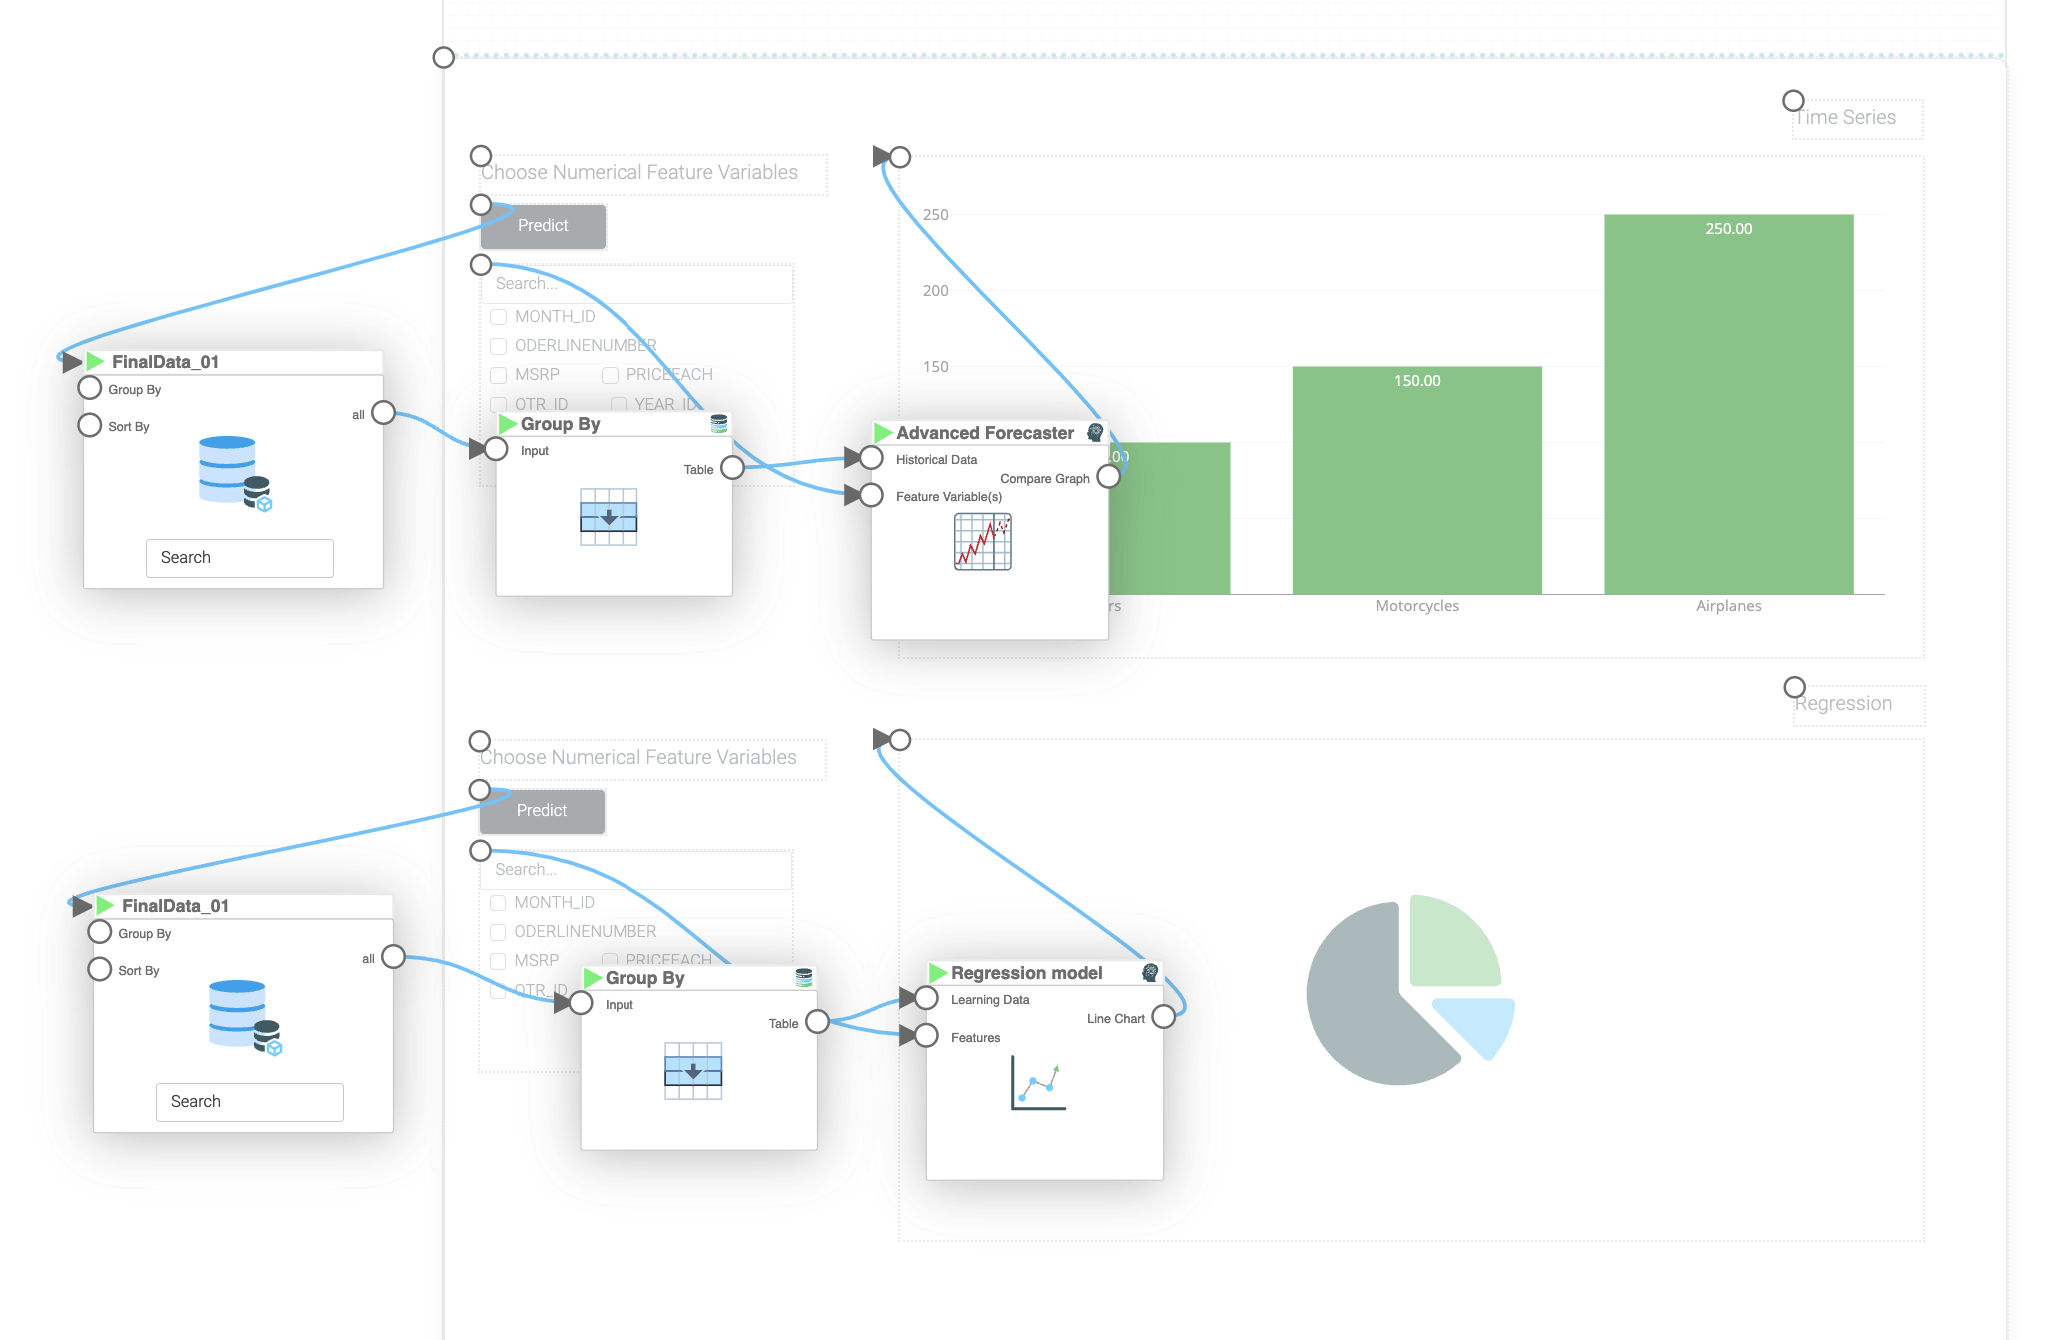
Build Time Series Model Logic
- In the logic flow, drag the "MyData" BLOX
- In the "MyData" BLOX settings, configure "Group By" to "ORDERDATE" and set "Aggregation" to "Sum" for all columns
- Connect the "MyData" BLOX to "Time Series Model" BLOX. In the "Time Series Model" BLOX settings, set "Time Variable" to "ORDERDATE", "Time Format" to "%Y/%m/%d", "Target Variable" to "SALES", "Look Back Window Size" to 50, "Training Intensity" to "Medium", and provide a model name
- Connect the first Multiselect template to the "Feature Variables" input of the "Time Series Model" BLOX
- Connect the first Button template to the "MyData" BLOX in the logic
- Connect the "Compare Graph" output from the "Time Series Model" BLOX to the first Chart template
Hint
Configure the Multiselect template by double-clicking it and adding feature variable options using the "Configure" button. Name the items the same as column names from your data (e.g., "QUANTITYORDERED", "PRICEEACH"). Users can select different combinations to see which features produce the most accurate predictions.
Build Regression Model Logic
- Connect the second Button template to the "MyData" BLOX in the logic
- Connect the "MyData" BLOX to "Regression Model" BLOX. In the "Regression Model" BLOX settings, set "Target" to "SALES", "Regression Type" to "Fifth Power", "Feature is time series" to "no", and provide a model name
- Connect the second Multiselect template to the "Features" input of the "Regression Model" BLOX
- Connect the "Line Chart" output from the "Regression Model" BLOX to the second Chart template
- Run the app and experiment with different feature variables for both models to compare their accuracy
Results and Summary
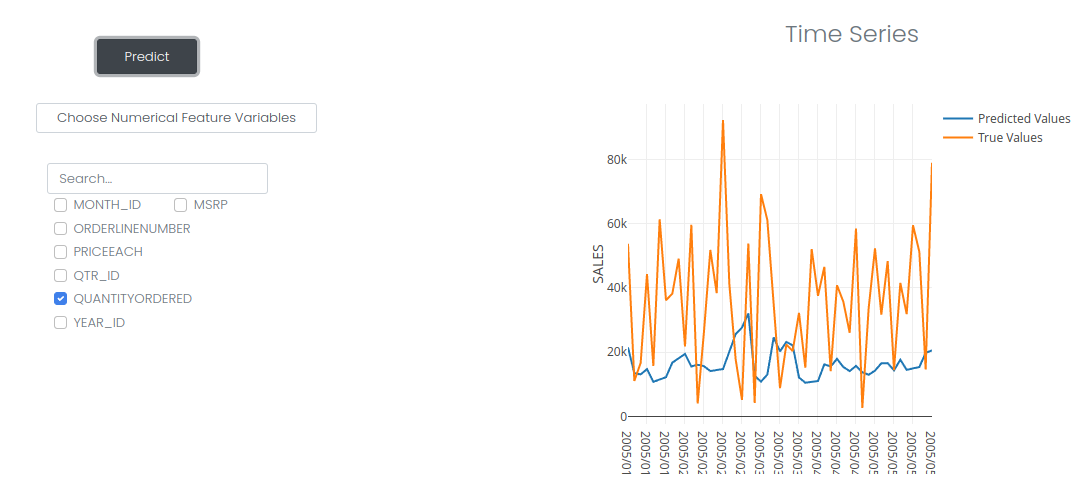

From the results, it is clear that the regression model fit the data better. Different data require different models, that is why it is crucial to have all these tools available when it comes to prediction.