Mission 4 - Multiple Sales Chart
Estimated time for completing this mission: 20 mins
Learning Objective
Easy way to change between different parameters for charts
BLOX used in this mission:
Logic BLOX
- MyData/FinalData
- Charts/Line Chart
App Templates
- Chart
- Input
- Button
- Label
Data
The same data set will be used as for the previous exercise. In case you do not have the data set you can download it here: FinalData.xlsx
Steps
Please refer to the Navigation Guide to perform the steps below
App Designer:
Multiple Sales Chart
- Import dataset from the Data section to Module5 folder
- In Module5, create a new app named Multiple Sales Chart
- Include all the app templates mentioned in the description above
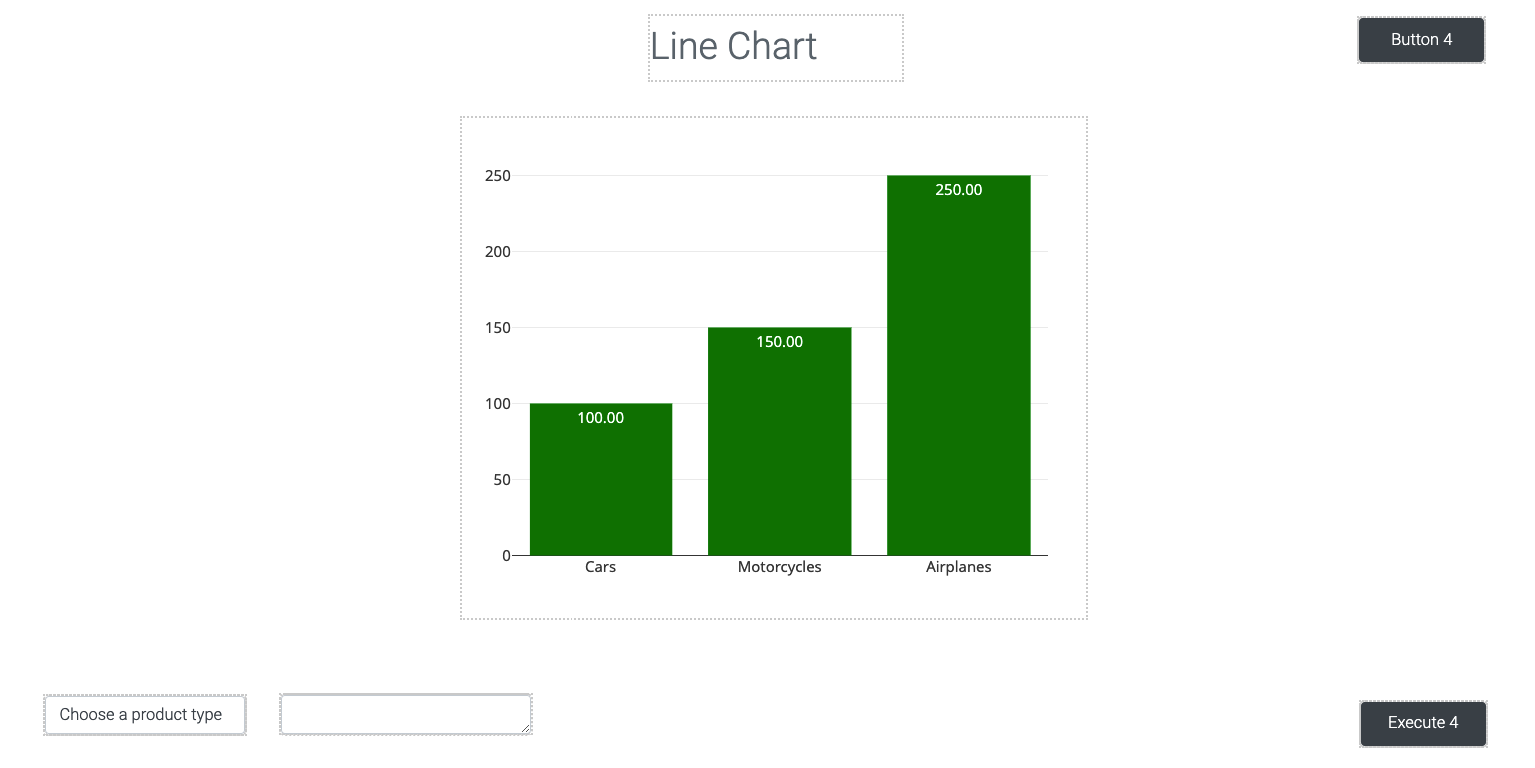
- Create the layout using the image shown below
-
Create a new logic by clicking the flask icon, then click New Logic. In the dropdown button next to the created logic, rename it to "Line Chart"
-
Create the outline of the logic as shown in the Logic composition figure below
- In the "MyData" BLOX settings, filter the "PRODUCTLINE" column by selecting "Contains" as the operation. Click the eye icon next to it to make the operand connectable.
- In the "MyData" BLOX settings, configure group-by by setting the "Group By" column to "ORDERDATE". Then click the + button after "Aggregation", select "all" in the first dropdown and "Average" in the second dropdown
- In the "MyData" BLOX settings, configure "Sort By" by setting the sorting column to "ORDERDATE"
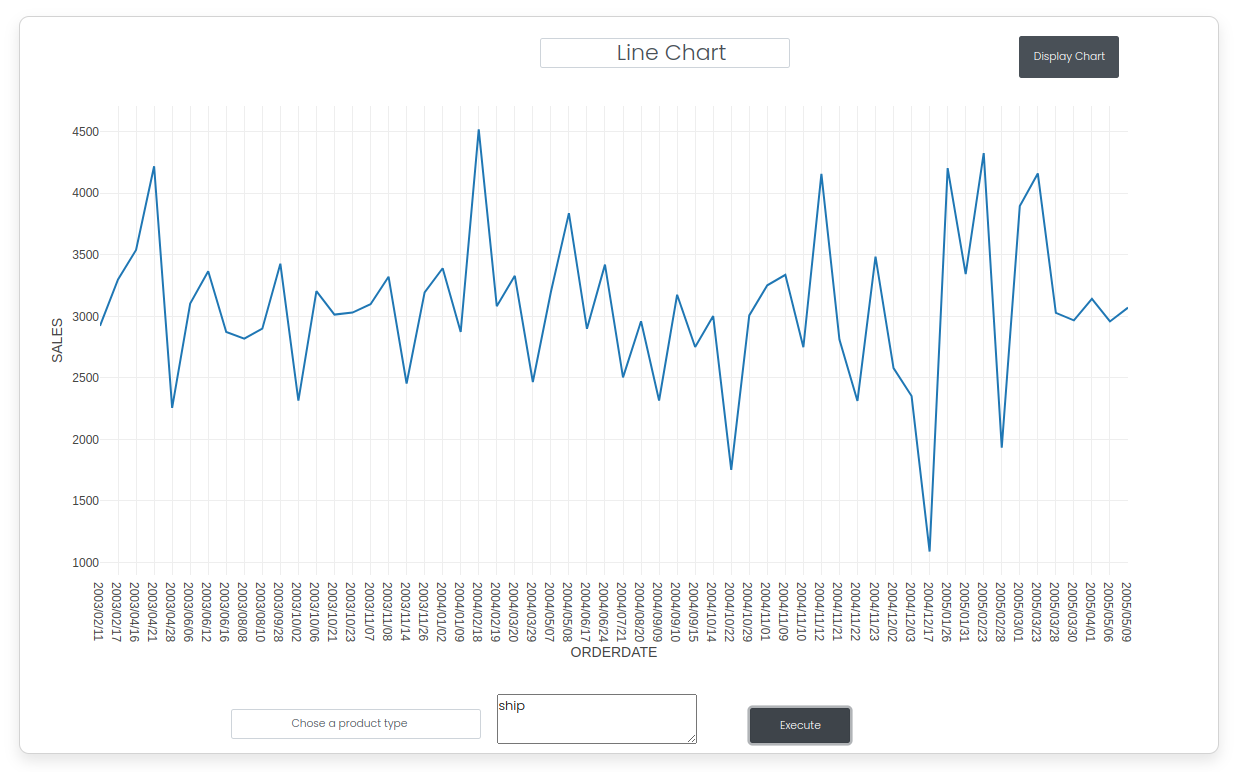
- In the "Line Chart" BLOX settings, set "Title" to "Daily Sales", specify "x" as "ORDERDATE", "y" as "SALES", and set the first two binary dropdowns to "yes"
- Run the app and choose a product to see different results (such as "ship" or "vintage") as shown in the result figures

Results and Summary