Know-How
This section provides you with all the necessary information to understand and complete the Module 5 - Dynamic Dashboards section which revolves around creating user-friendly Dashboards using LOGIBLOX.
What is a Dashboard?
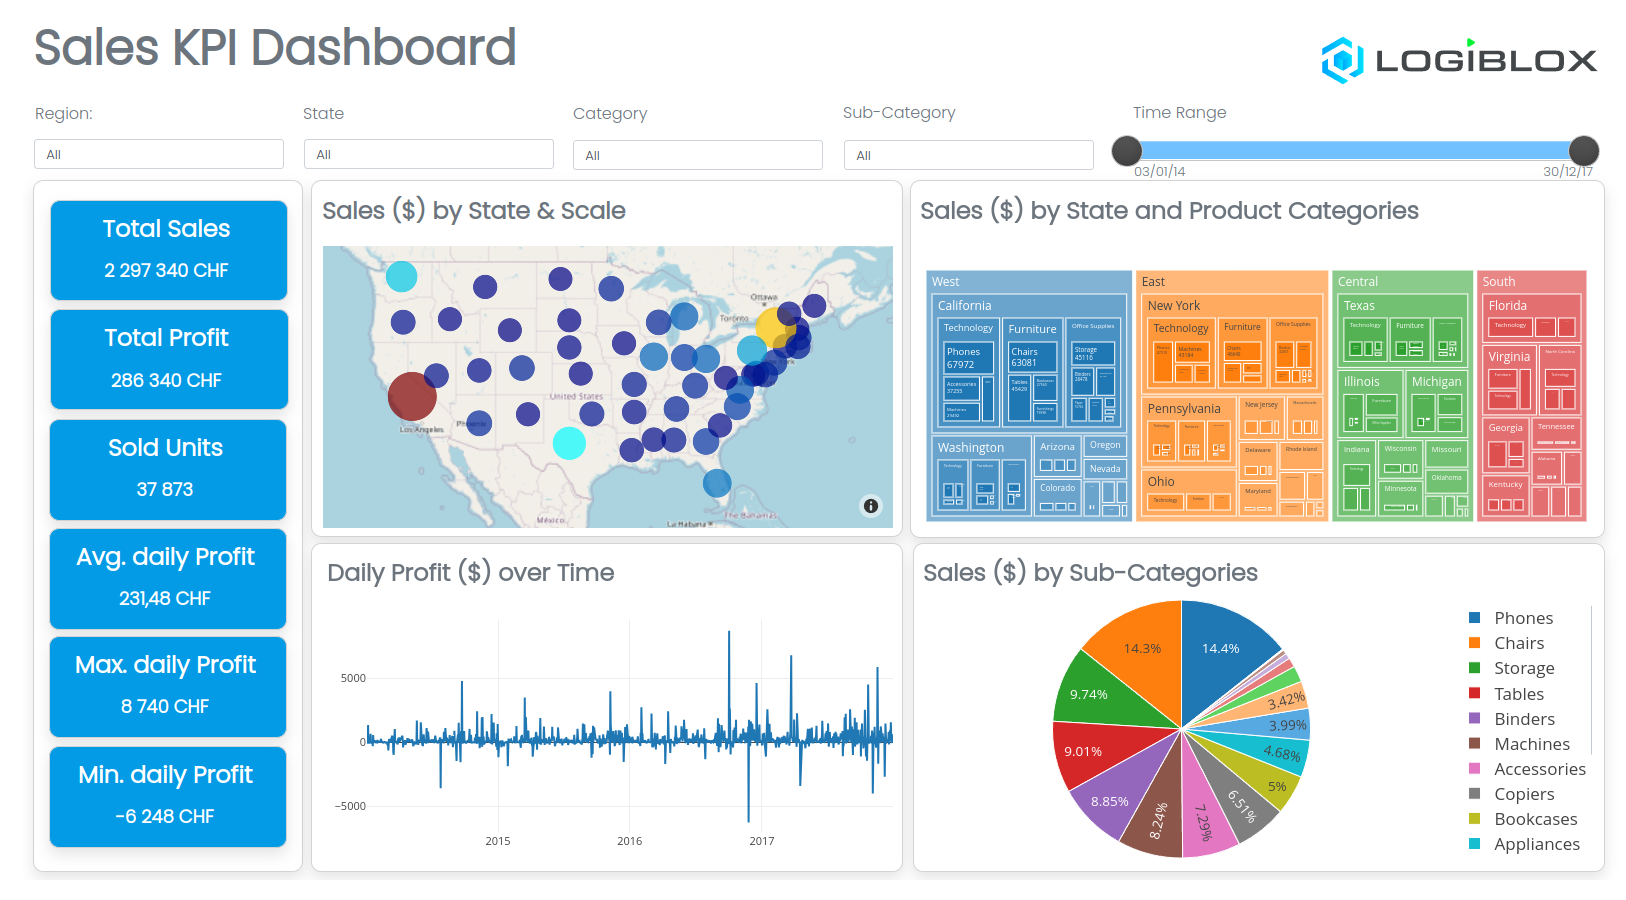
A dashboard is a visual display of your data. While it can be used in all kinds of different ways, its primary intention is to provide information at-a-glance, such as KPIs.
A dashboard receives information from one or more data-sources and is updated as new data is added to the database. More advanced dashboards are also configurable, allowing you the ability to choose which data you want to see and whether you want to include charts or graphs to visualize the numbers. Interactive dashboards allow the user to drill down into the data to get more information about a specific area, i.e. using filters, data slicers or interactive graphs.
Why you should use Dashboards?
Some of the benefits of using dashboards for data visualizations include:
- A visual representation of performance, such as with charts and graphs
- The ability to identify trends
- An easy way of measuring efficiency
- The means to generate detailed reports with a single click
- The capacity to make more informed decisions
- Total visibility of all systems, campaigns, and actions
- Quick identification of data outliers and correlations