Mission 6 - Multiple Regressions
Estimated time for completing this mission: 20 mins
Learning Objective
Building a multiple regression model with more than one independent variables.
Scenario
In many cases, only one independent variable will not predict the dependent variable too precisely hence, building a multiple regression model with more than one independent variable can be helpful.
Know-How Refresh
Multiple regression is similar to linear regression, but it has multiple independent variables instead of one.
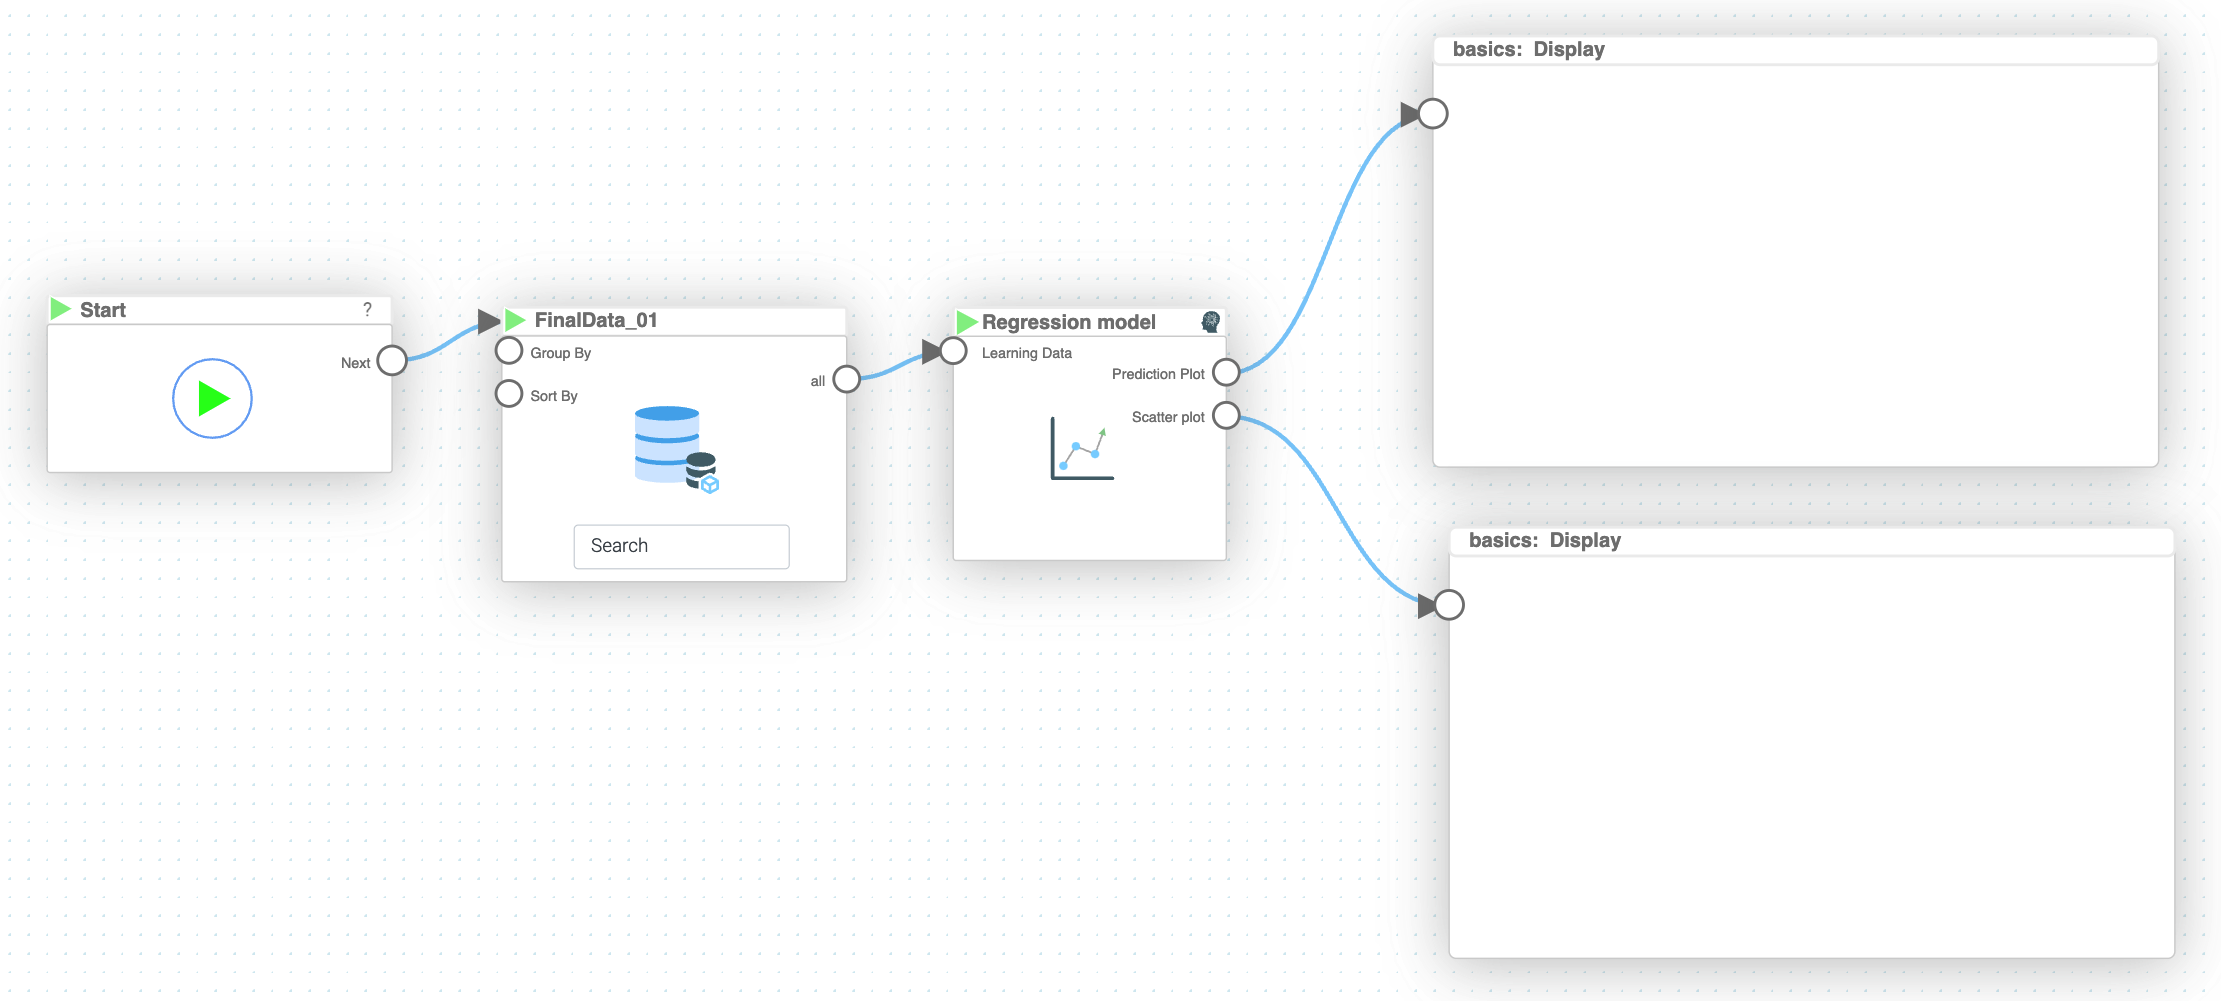
BLOX used in this mission:
- Basics/Start
- MyData/FinalData
- AI/Regression Model
- Basics/Display x2

Data
In this mission we will use the prepared dataset from the previous section.
If you have not created it, here is a link for the dataset FinalData.xlsx
Steps
- In the Module 4 folder click the "Add Item" button to create a new logic named Multiple Regression
- Drag-and-drop blox that will be used for this mission including the dataset FinalData
- Connect the "Start" BLOX to the "MyData" BLOX
- Now connect the output from "MyData" to "Regression" BLOX, but the input for the "Regression" BLOX is a new challenge for you. What do you think would make sense for x and y variables? For the "Exponential Degree" use "quadratic" as we have seen in the previous mission, that a non-linear exponential degree improves the prediction. (For further information, please refer to the Know-How section.) Give a name to the model and make sure you set the "x is Time Series" to "No" (unless you would like to use "ORDERDATE" as a predictor, that case chose "Yes".)
- In the side bar of "Regression Model" click on eye icon for "Scatter Plot" and "Line Chart" to make outputs for charts
- Connect both newly created outputs to the "Display" BLOX, and press Run button to execute the logics and see the results
Hint (recommended variables)
Connect the output from "MyData" to "Regression" BLOX and specify x and y (x:"COUNTRY,PRODUCTLINE,PRICEEACH" and y: "SALES" in our case). We have chosen y as "SALES" since in general, predicting the future sales are important for many business. For the x values (the independent variables), we have chosen "COUNTRY,PRODUCTLINE,PRICEEACH" as these variables could highly effect the amount of sales.Results and Summary
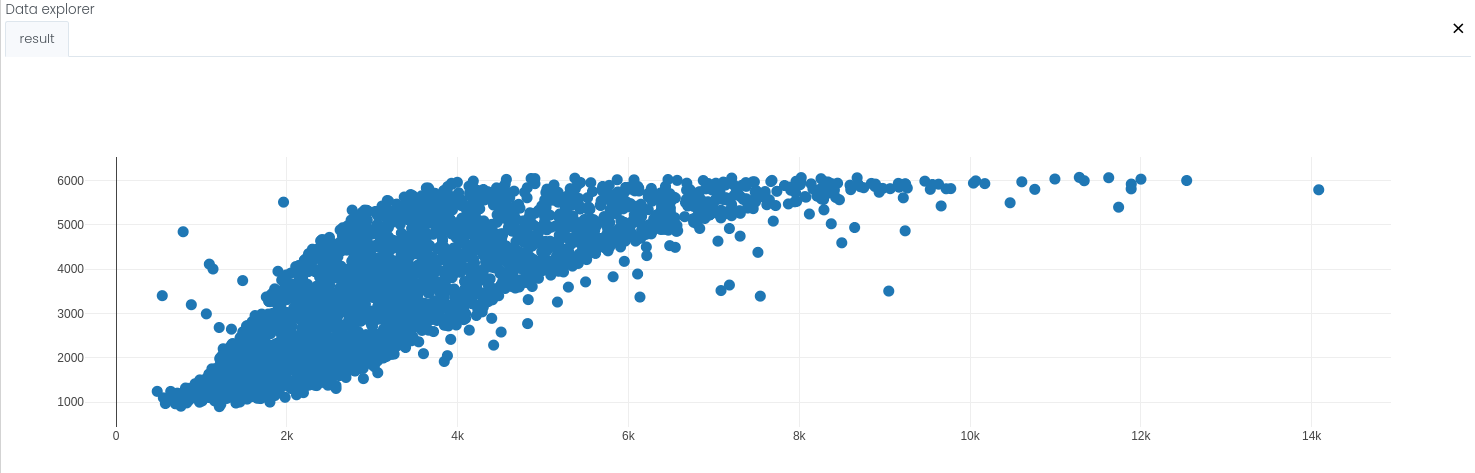
The figure above depicts the True values (on the x-axis) against the Predicted values (on the y-axis). In a perfect case, the dots would be on a diagonal line.
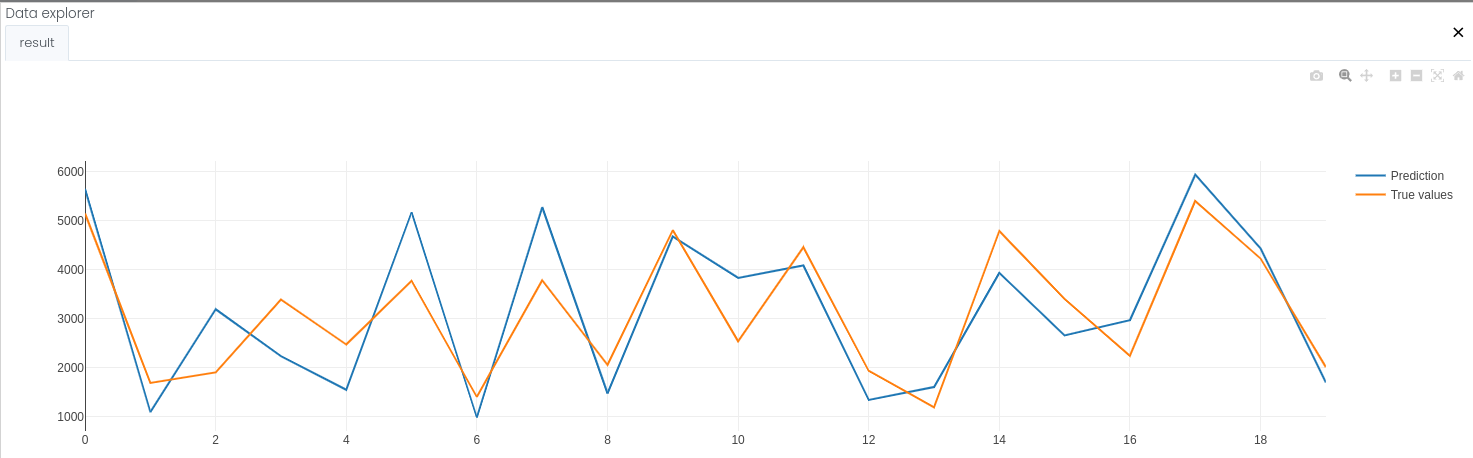
The second figure shows the predicted "SALES" values and the true "SALES" values in one line chart. This makes it easy to compare the accuracy of the prediction.
Now you should see the multiple regression in the "Display" BLOX, representing the regression calculated based on the provided data with the "SALES" values as the dots.