Mission 5 - Non-Linear Regressions
Estimated time for completing this mission: 10 mins
Learning Objective
Further exploring the capabilities of regression in LOGIBLOX using prepared Dataset.
Scenario
In the previous mission you created a linear regression model, i.e. of first degree in the input variables. Now you feel that you should improve the accuracy of the regression model and graph.
Know-How Refresh
Aiming for better accuracy can be achieved by changing the degree of the regression. The higher the degree the more curvy the regression curve will be, and thus the better it can fit the data.
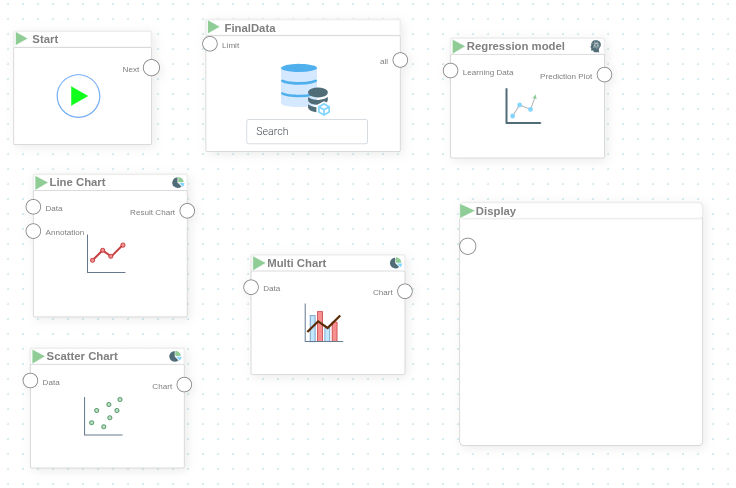
BLOX used in this mission:
- Basics/Start
- MyData/FinalData
- AI/Regression Model
- Charts/Line Chart
- Charts/Scatter Chart
- Charts/Multi Chart
- Basics/Display
Data
In this mission we will use the prepared dataset from the previous section.
If you have not created it, here is a link for the dataset FinalData.xlsx
How To Guide
Please refer to the Navigation Guide to perform the steps below
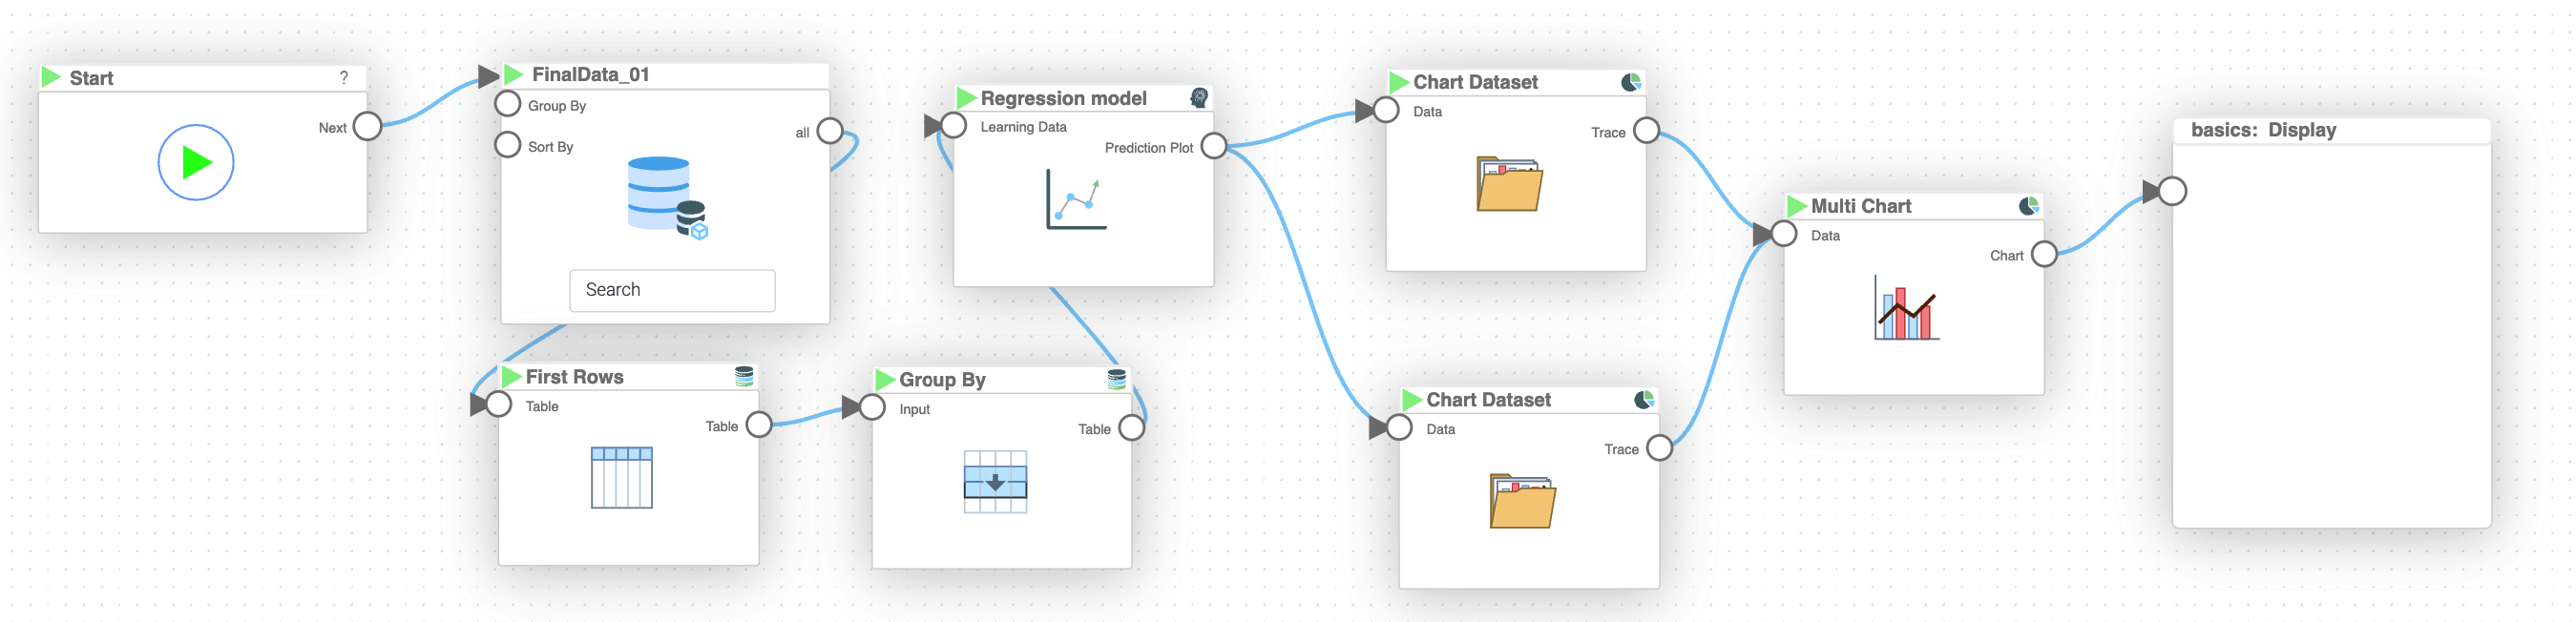
- You will be working in the same logic sheet as in the previous mission
- Copy the logic from the previous mission (which uses "MyData" BLOX with "Limit" and "Group By" settings, "Regression Model" BLOX, "Line Chart" and "Scatter Chart" BLOX, and "Multi Chart" BLOX)
- In the "Regression Model" BLOX settings, try out different polynomial degrees to see how the accuracy changes (Remember, that higher "Exponential Degree" makes the regression line more curvy, which in many cases could lead to better accuracy)
Results and Summary
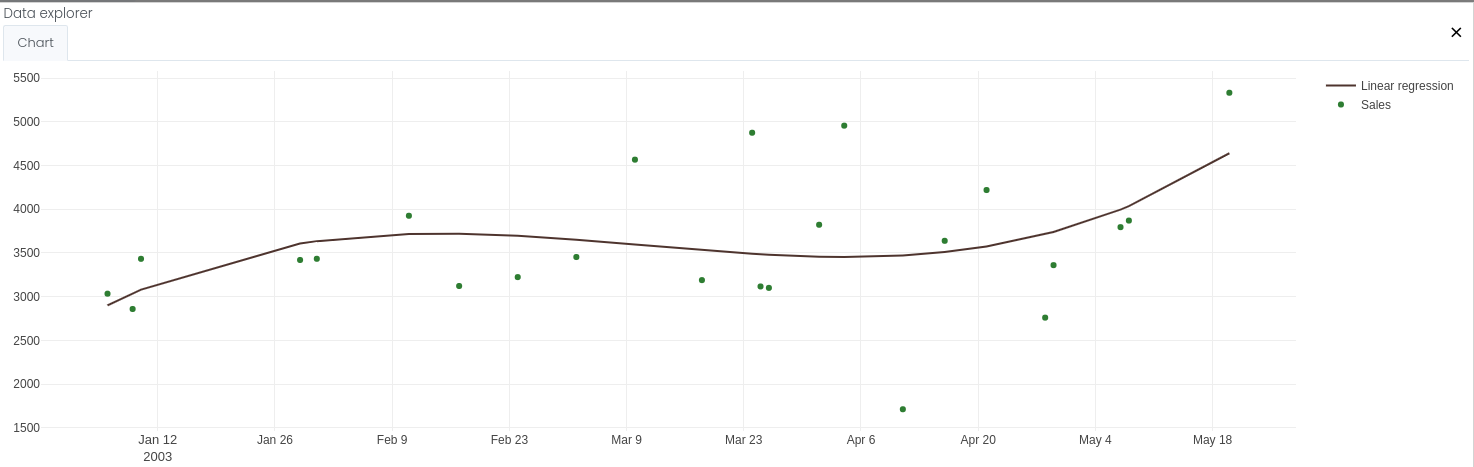
Now you should see the regression in the "Display" BLOX, representing the regression calculated based on the provided data.