Mission 4 - Linear Regressions
Estimated time for completing this mission: 20 mins
Learning Objective
Create regression models in LOGIBLOX using prepared Dataset.
Scenario
You were tasked with creating a simple regression, using the information from the correlation matrix.
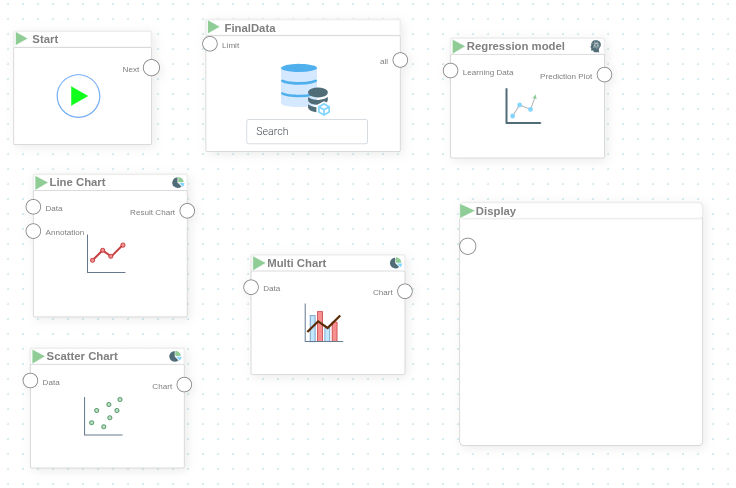
BLOX used in this mission:
- Basics/Start
- MyData/FinalData
- AI/Regression Model
- Charts/Line Chart
- Charts/Scatter Chart
- Charts/Multi Chart
- Basics/Display
Data
In this mission we will use the prepared dataset from the previous section.
If you have not created it, here is a link for the dataset FinalData.xlsx
Steps
Please refer to the Navigation Guide to perform the steps below
Flow Builder:
Creating regressions
- In Module4 in logic section create new logic named Linear Regression
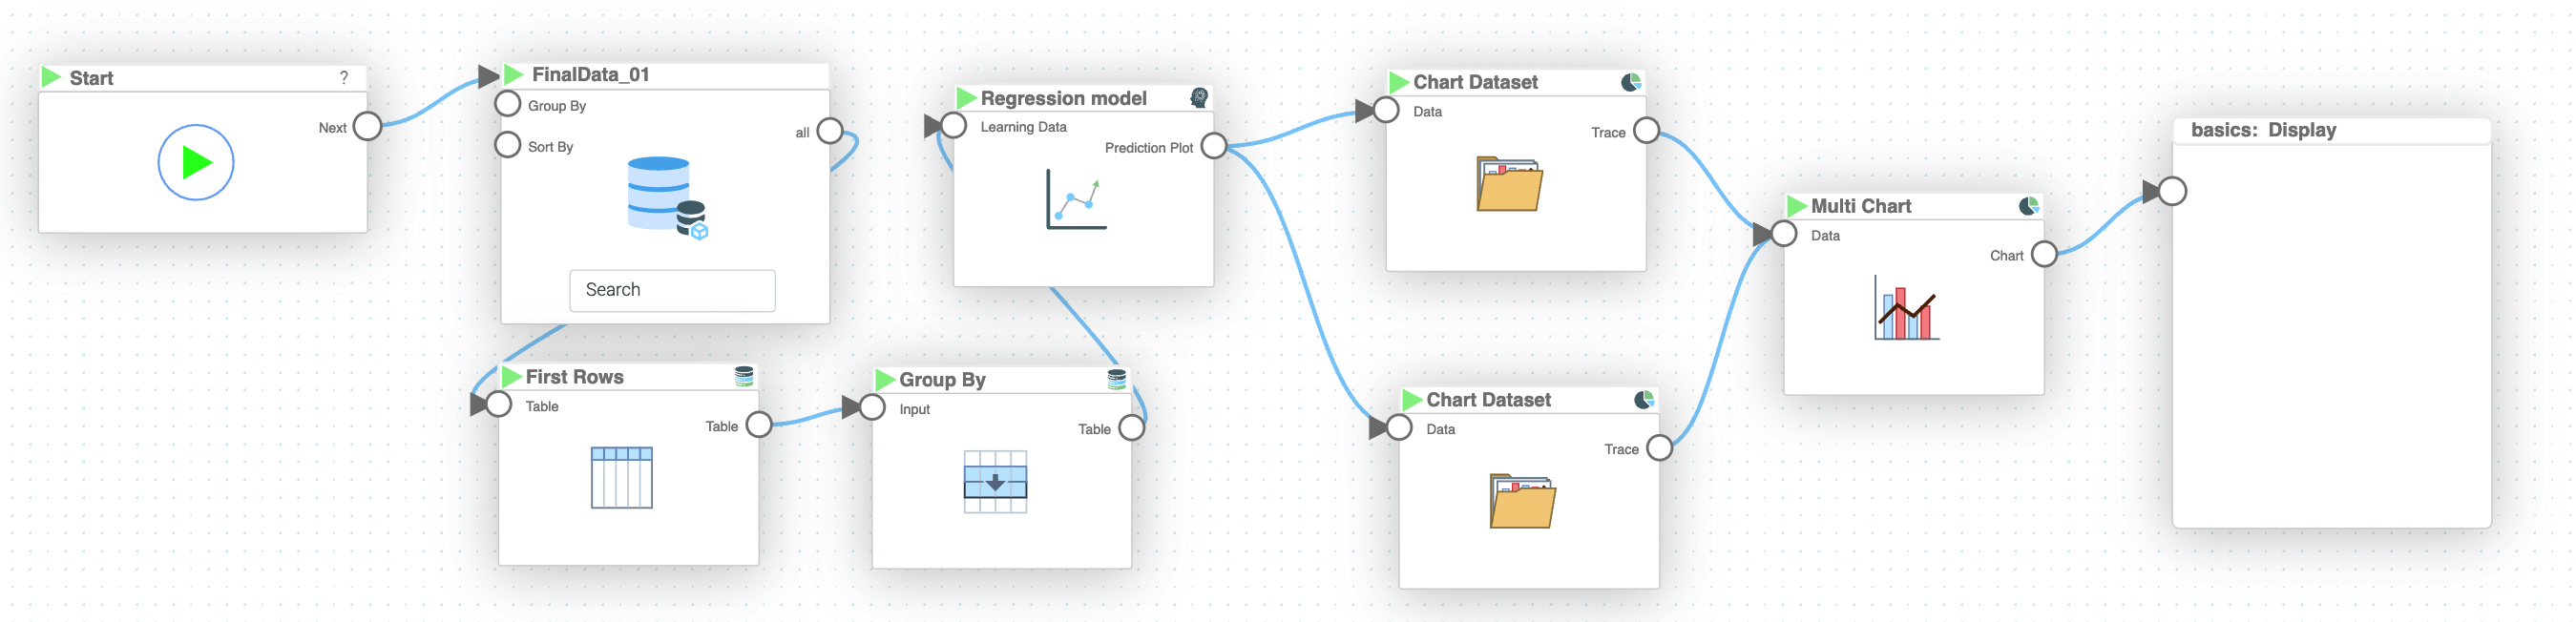
- Drag-and-drop all the necessary BLOX listed above including the dataset FinalData
- Connect the "Start" BLOX to the "MyData" BLOX
- In the "MyData" BLOX settings, set "Limit" to 50 (the more rows, the harder it will be for Regression Model to create accurate predictions)
-
In the "MyData" BLOX settings, configure grouping to aggregate the dates. The goal is to handle cases when multiple orders are made on one day and take the mean of the other values
Hint
In the "MyData" BLOX settings, set "Group By" to "ORDERDATE". Then click the + button after "Aggregation", select "all" in the first dropdown and "Average" in the second dropdown.
-
Connect the output from "MyData" BLOX to "Regression Model" BLOX. In the "Regression Model" BLOX settings, specify "Features" as "ORDERDATE" and "Target" as "SALES", set "Regression Type" to "Linear", set "Feature is time series" to "yes" (as "ORDERDATE" is a time series variable), and specify the name of the regression model as "Linear Model"
-
Connect the output from "Regression Model" BLOX to "Line Chart" BLOX. In its settings, specify the x and y axis as "ORDERDATE" and "y_pred", set "Title" to "Predicted Result", and optionally the color
-
Connect the "Regression Model" BLOX to "Scatter Chart" BLOX. In its settings, specify x and y as "ORDERDATE" and "y", set "Title" to "Truth Data", and optionally color
-
Connect the output from both "Line Chart" and "Scatter Chart" BLOX to "Multi Chart" BLOX. In the "Multi Chart" settings, set "Title" to "Predicted vs Truth", set "Multiple Y Axis" to "No", set "Subplots" to "No", and set "Continuous X" to "yes". Finally, connect the output from "Multi Chart" to "Display" BLOX and click the play button to execute the logic
Tip
You can look up the accuracy of the regression model if you double click on "Regression Model" BLOX and go to "Prediction Score" tab. The closer the value is to 1, the more accurate the predictions are.
Results and Summary
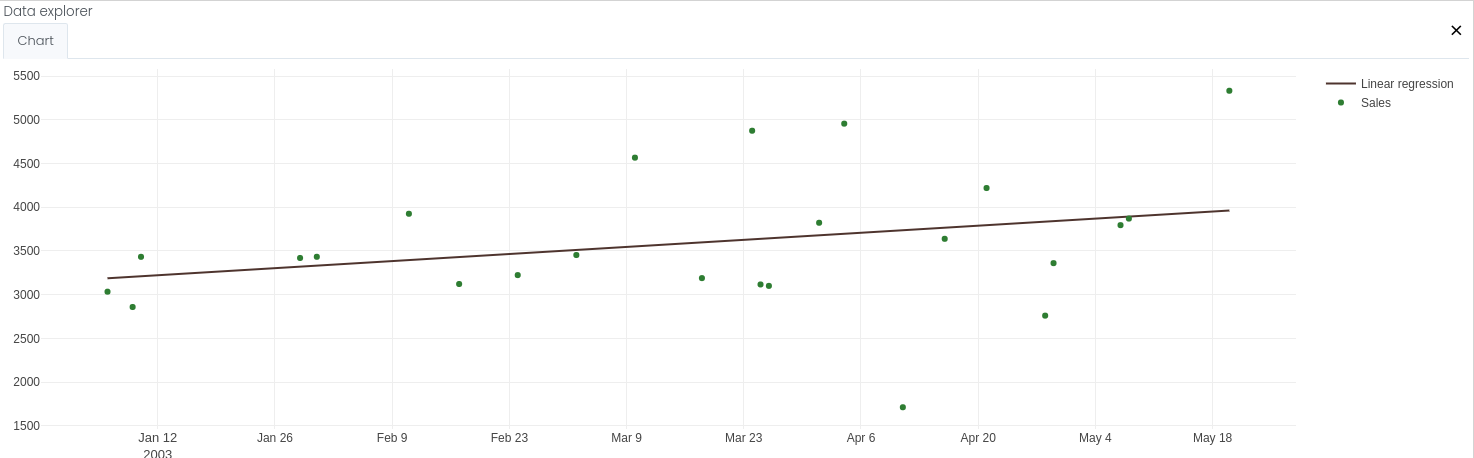
Now you should see the regression in the "Display" BLOX, representing the regression calculated based on the provided data.