Mission 3 - Correlations
Estimated time for completing this mission: 15 mins
Learning Objective
Creating a heatmap with prepared data using LOGIBLOX tools.
Scenario
You were tasked with creating a heatmap, using the dataset you have prepared, in order to see correlations between the columns.
BLOX used in this mission:
- Basics/Start
- MyData/FinalData
- AI/Correlation
- Basics/Display

Data
In this mission we will be using the previously prepared dataset (which you created in the previous section).
If you have not created it, here is a link for the dataset FinalData.xlsx
How To Guide
Please refer to the Navigation Guide to perform the steps below
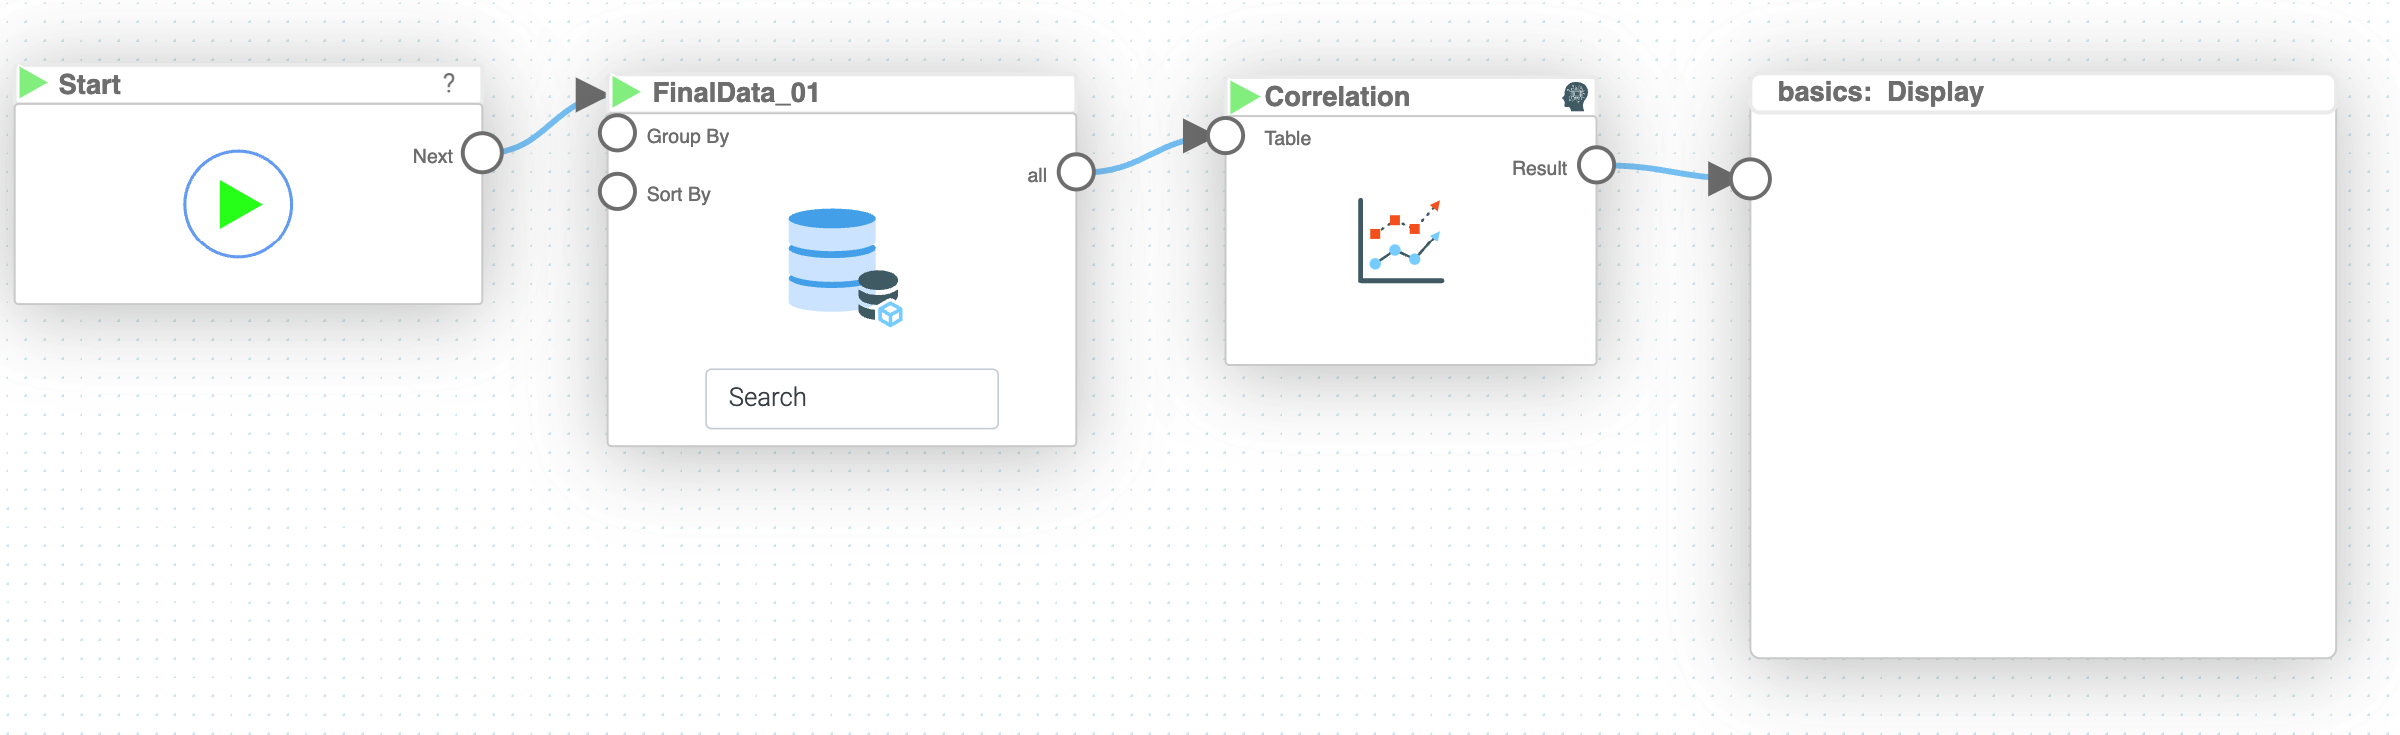
Flow Builder:
Creating heatmaps
- In Module4 in logic section create new logic named Correlation
- Drag-and-drop blox that will be used for this mission including the dataset FinalData
- Connect "Start" BLOX to the "MyData" BLOX
- Connect the output from the dataset to the "Correlation" BLOX
- In the nav bar of "Correlation" BLOX, go to outputs tab and click the eye icon for "heatmap"
- Connect the "heatmap" output from "Correlation" BLOX to the input of "Display" BLOX
- Now press the play button to execute the logics chain
Results and Summary
Now you should see the heatmap in the "Display" BLOX, representing the correlations in the dataset.