Mission 9 - Predict Series
Estimated time for completing this mission: 20 mins
Learning Objective
Understanding how to create a prediction graph using LOGIBLOX tools and previously trained time series model.
Scenario
Now that you have trained the model, you can use it to create a prediction graph, representing the expected sales performance in the future.
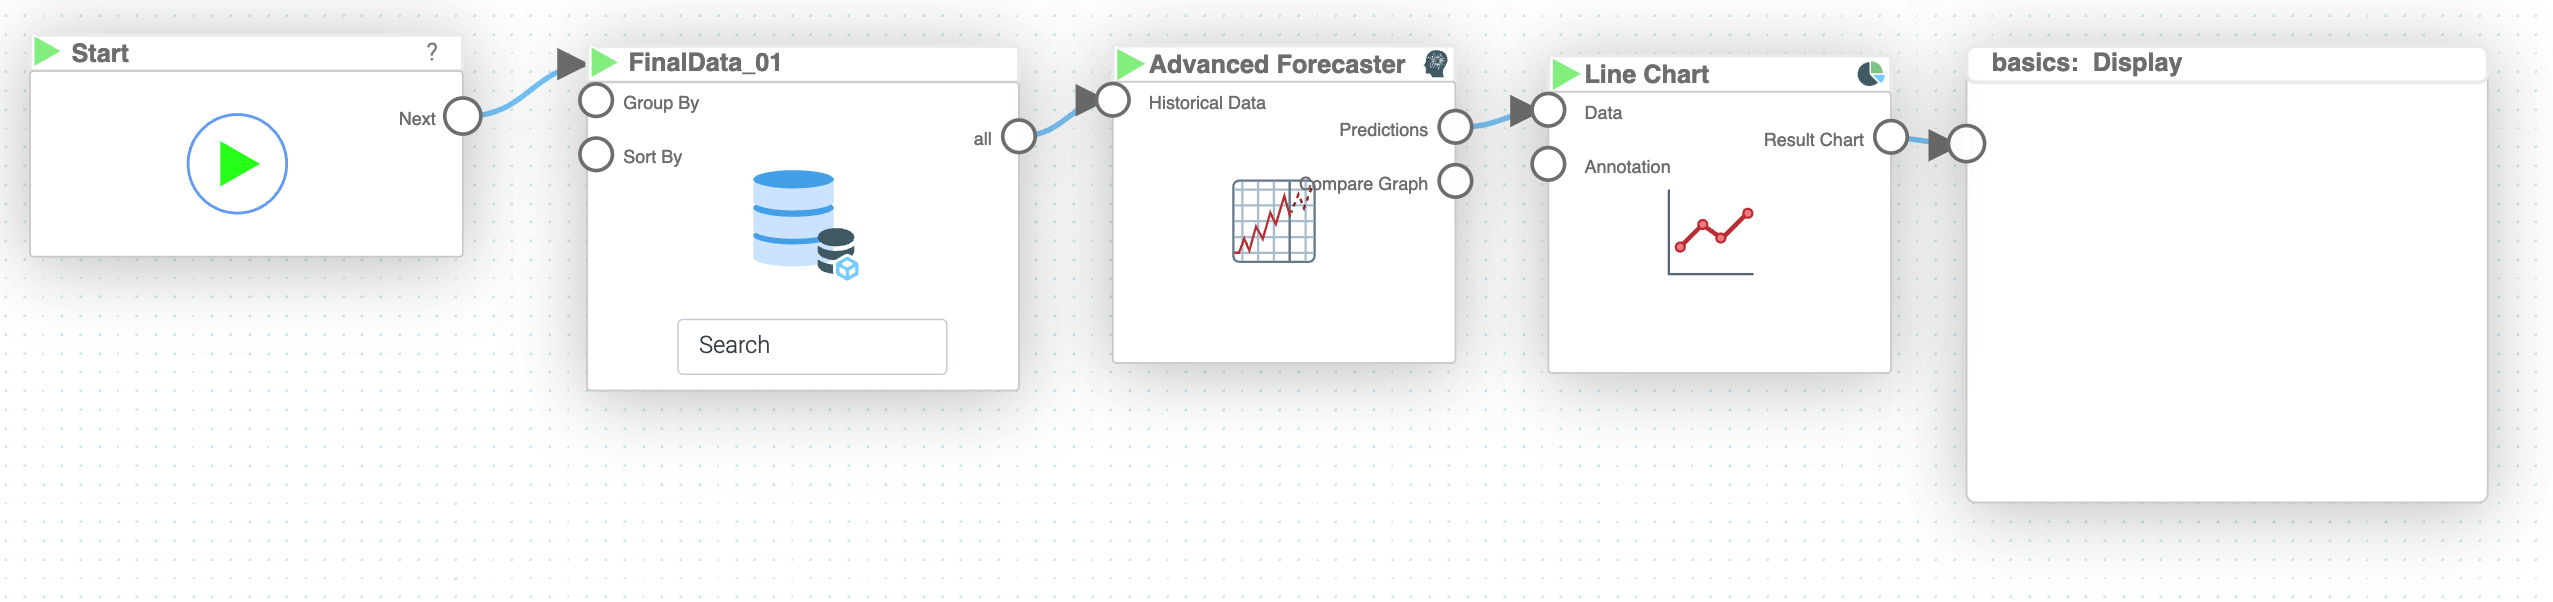
BLOX used in this mission:
- Basics/Start
- MyData/FinalData
- AI/Advanced Forecaster
- Charts/Line Chart
- Basics/Display

Data
You do not need any new dataset to complete this mission.
Steps
Please refer to the Navigation Guide to perform the steps below
- In the Module 4 folder click the "Add Item" button to create new logic named Predict Series
- Drag-and-drop all the necessary BLOX listed above
- Connect the "Start" BLOX to the "MyData" BLOX
- Connect the "MyData" BLOX to the "Advanced Forecaster" BLOX. In the "Advanced Forecaster" BLOX settings, specify "Model" as "Time Series Model" and set the number of predictions to 20
- Connect the output from "Advanced Forecaster" BLOX to "Line Chart" BLOX. In the "Line Chart" BLOX settings, set "x" to Date, "y" to SALES Prediction, "Show Axis Label" to "yes", and "Tilt Tick" to "yes"
- Connect the output from "Line Chart" BLOX to "Display" BLOX and press the play button to execute the logic
Results and Summary