Mission 14 [Own Mission] - ABCXYZ Analysis
Estimated time for completing this mission: 20 mins
Learning Objective
Learning how to perform complex business analysis using LOGIBLOX tools.
Scenario
The final step is to create an overall ABCXYZ Analysis which is derived from both ABC and XYZ Analysis BLOX. It is fairly simple to do so, if you have the mentioned BLOX already prepared, as the only thing left to do is to connect the outputs to the ABCXYZ BLOX to receive meaningful results.
Now that you have a dataset ready to be used for more complex charts, you can perform ABCXYZ Analysis with it. You have been tasked with creating a cluster chart describing ABCXYZ classification on products from Class 3.
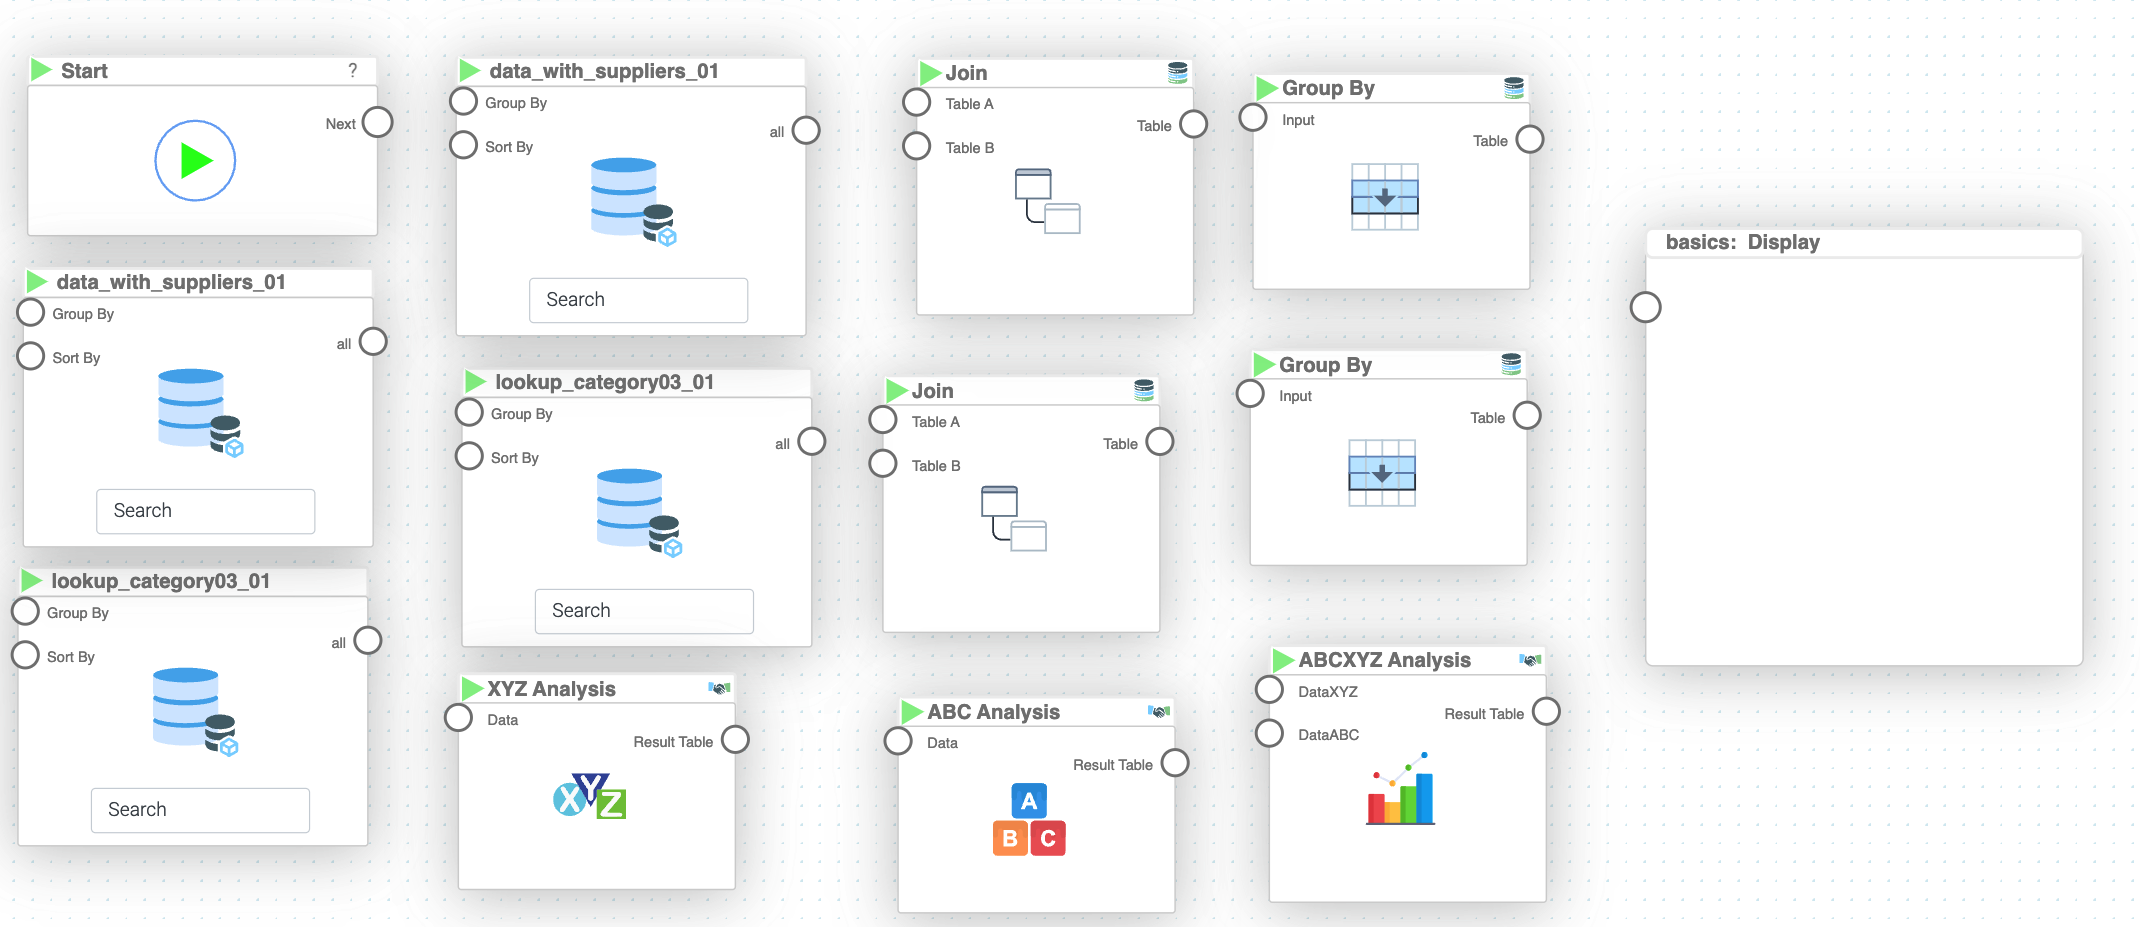
BLOX used in this mission:
- Basics/Start
- MyData/data_with_suppliers.xlsx x2
- MyData/lookup3.xlsx x2
- Database/Join x2
- Database/Group By x2
- Business/XYZ Analysis
- Business/ABC Analysis
- Business/ABCXYZ Analysis
- Basics/Display
Data
Dataset with lookups: lookup3.xlsx
In this mission we will use the prepared dataset from the previous section.
If you can not create it, here is a link for the dataset data_with_suppliers.xlsx
Steps
Please refer to the Navigation Guide to perform the steps below
- In the Flow Builder, drag-and-drop appropriate data set from "MyData" section
- The "XYZ Analysis" is the same in this mission as the one you have produced in the previous one (Mission 11)
- For the "ABC Analysis" follow the instructions specified in Mission 10 (ignore the step 4. this time)
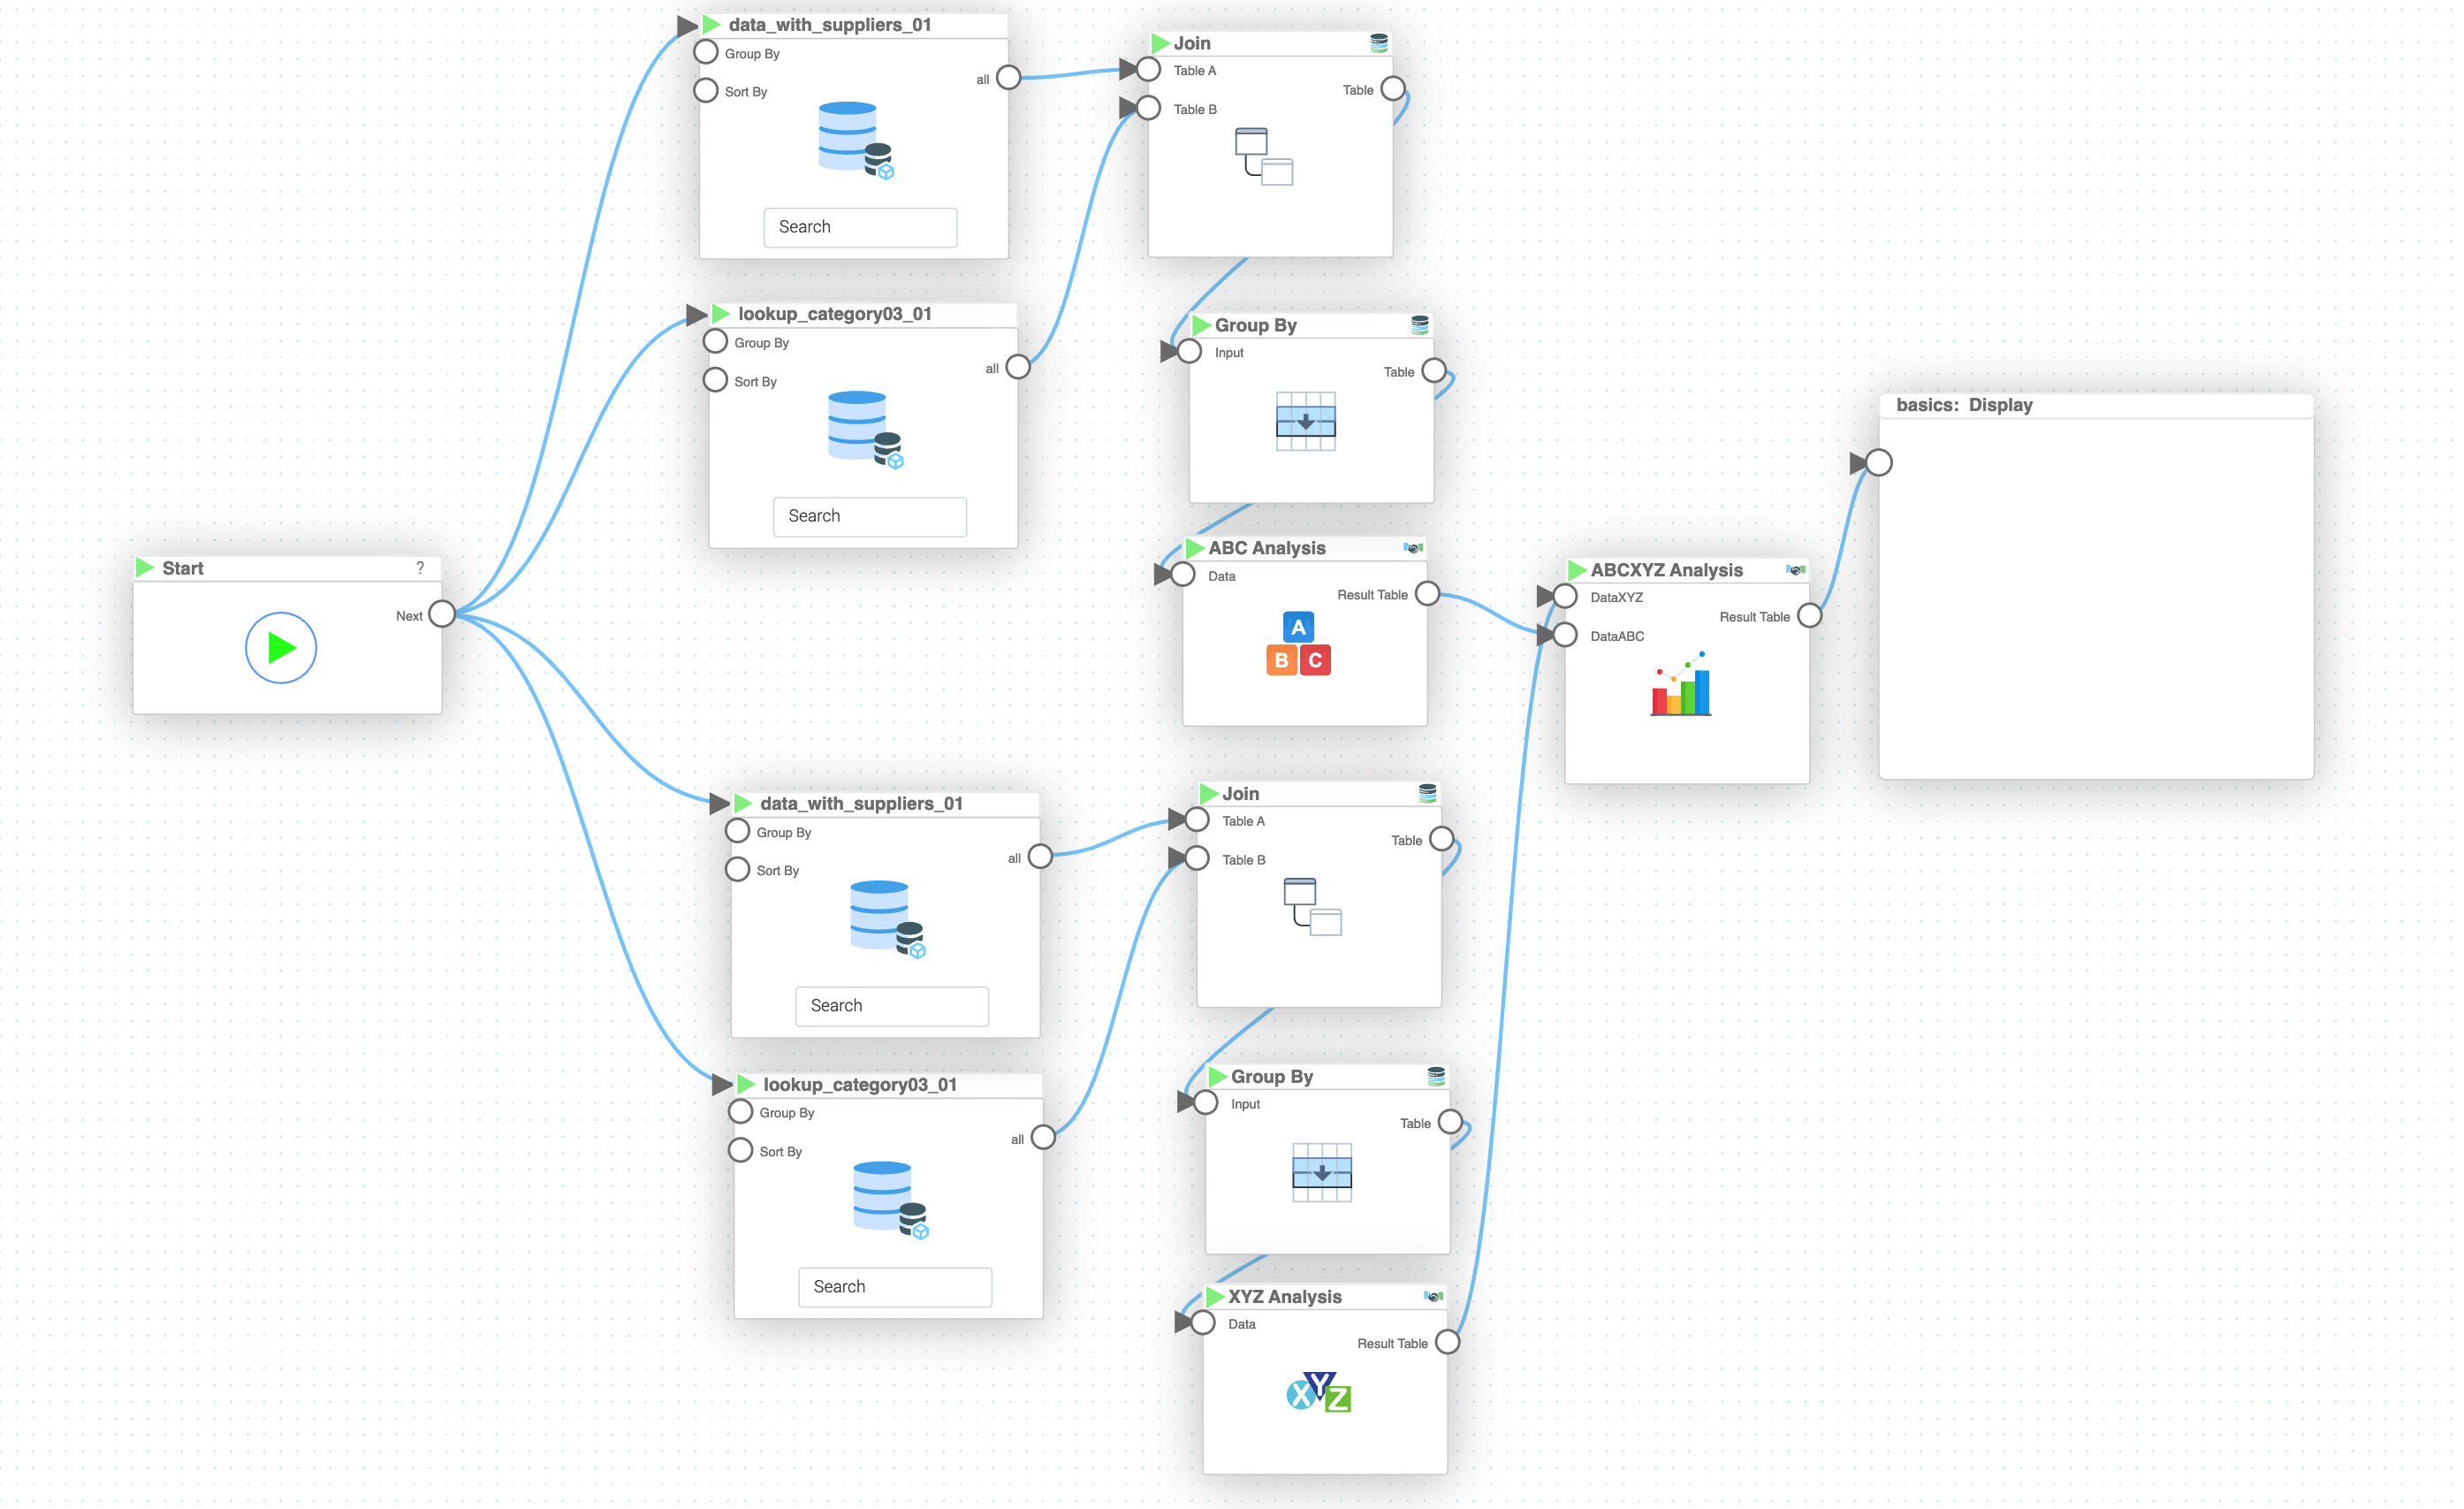
- Now we can connect the 'Result Table' from "ABC Analysis" and "Data for ABCXYZ" from "XYZ Analysis" (you can find this output in the sidebar under "Output" tab) to ABCXYZ inputs
- Connect the "Cluster Chart" from "ABCXYZ" BLOX (you can find this output in the sidebar under "Output" tab)
- In the "ABC XYZ Analysis" BLOX, select "Name_Category_Level_3" for "Products List" and "Amount" in "Profits List"
- Connect the "Start" BLOX to the datasets, connect all other BLOX to each other and press play button to execute the logic
Tip
In the "ABCXYZ Analysis" BLOX sidebar, in the output tab, you can find a few more graphs you can display, and get meaningful information about the dataset
Results and Summary
Feel free to explore all the tabs with different "Display" BLOX!
Congratulations! You have now completed all the missions from module 1! If you wish to do additional exercises, you can find them here.