Mission 13 [Own Mission] - XYZ Analysis
Estimated time for completing this mission: 20 mins
Learning Objective
Learning how to perform complex business analysis using LOGIBLOX tools.
Scenario
XYZ analysis is very useful for business analysis but even harder to produce compared to ABC Analysis. With LOGIBLOX, creating comprehensive XYZ analysis is really easy. All you need is a dataset the containing SKUs column, dates of the transactions as well as the quantity.
BLOX used in this mission:
- Basics/Start
- MyData/data_with_suppliers
- MyData/lookup3
- Database/Join
- Business/XYZ Analysis
- Database/Group by
- Basics/Display
Data
Dataset with lookups: lookup3.xlsx
In this mission we will use the prepared dataset from the previous section.
If you can not create it, here is a link for the dataset data_with_suppliers.xlsx
Steps
Please refer to the the Navigation Guide to perform the steps below
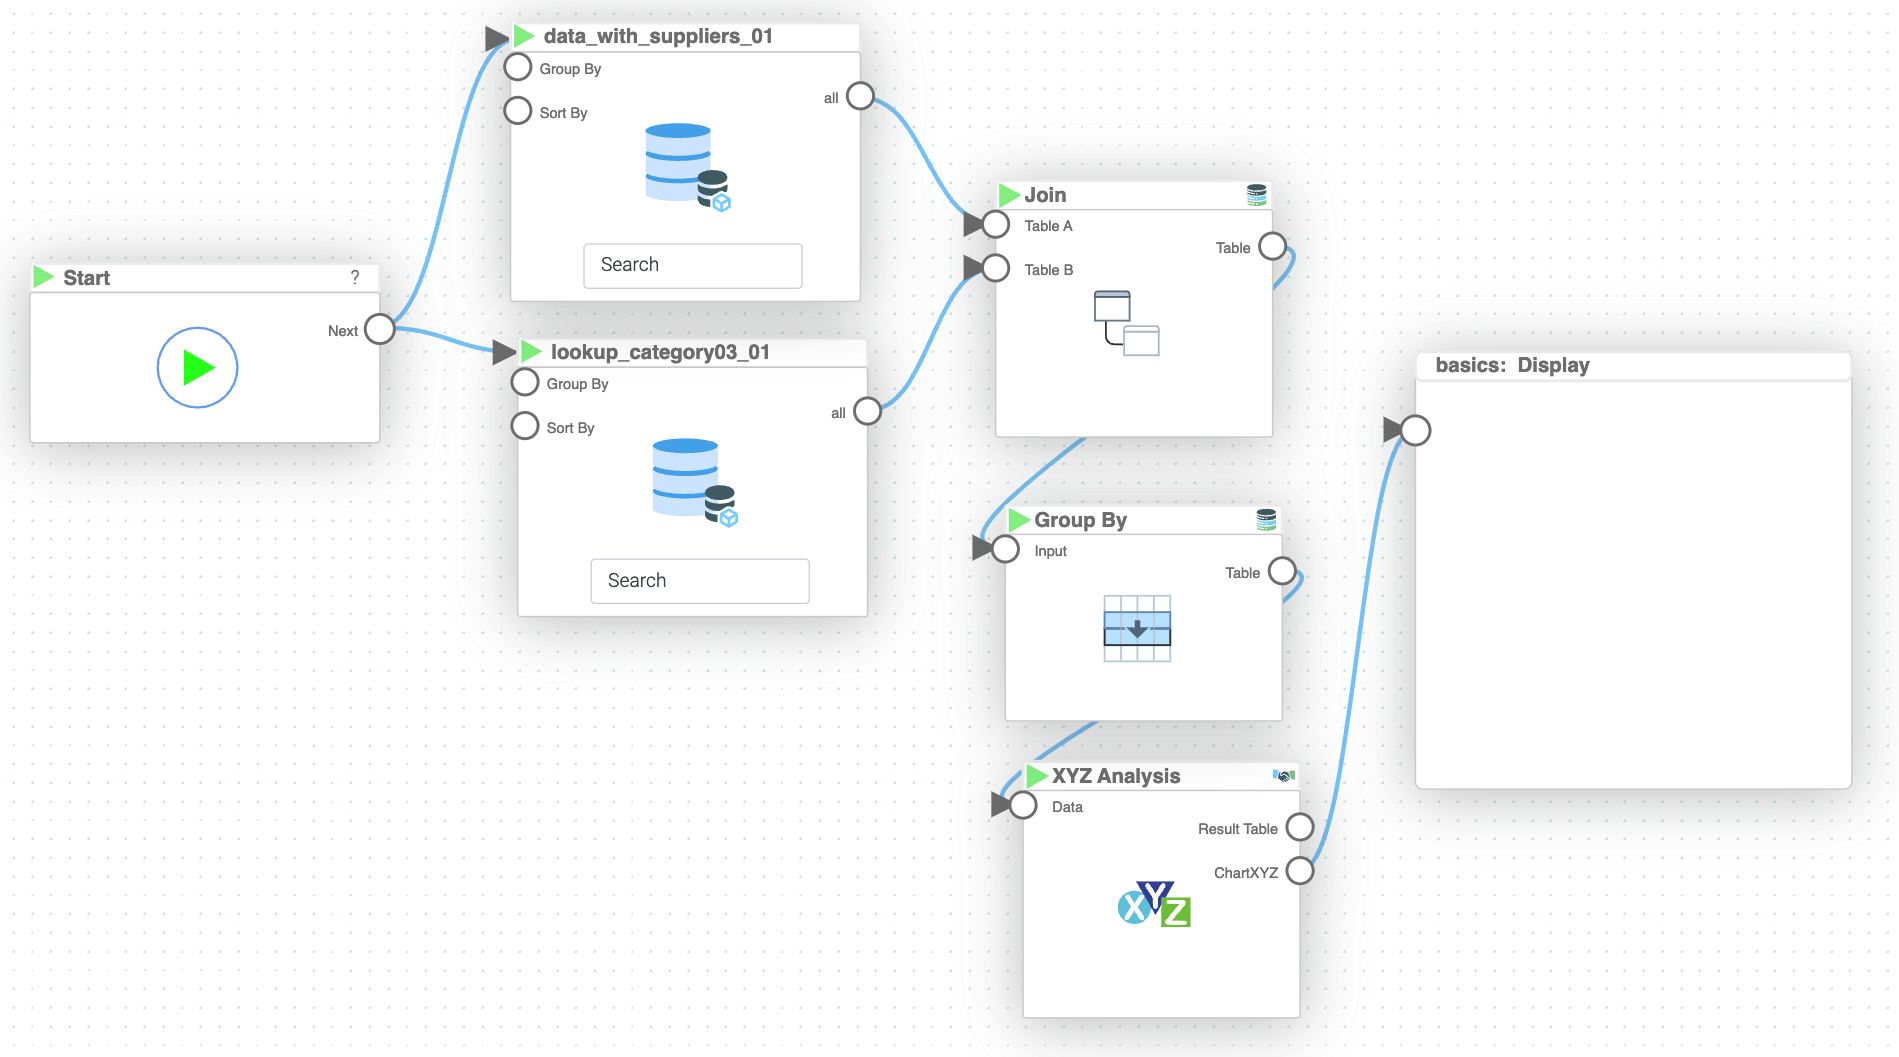
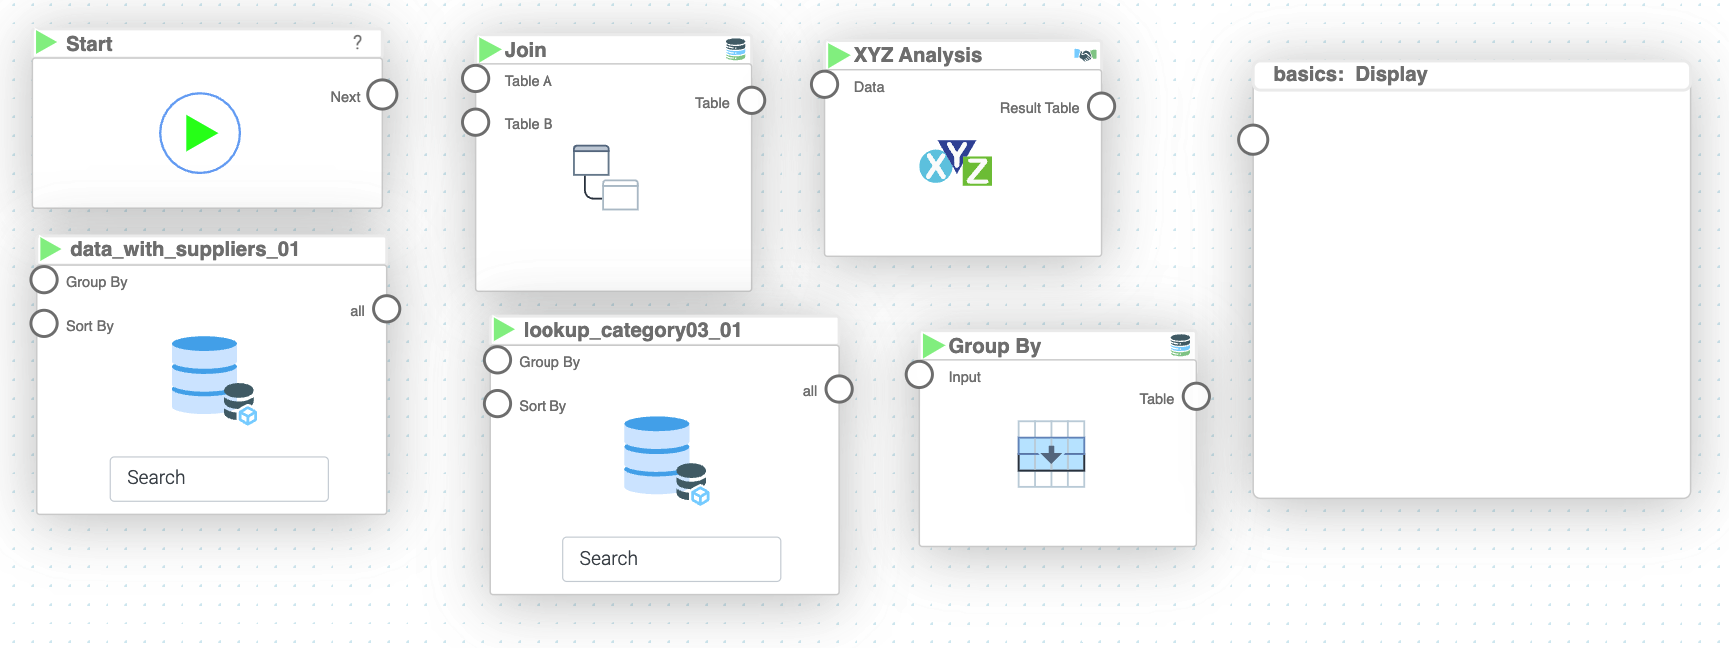
- In the Flow Builder, drag-and-drop elements listed above
- First perform a left join operation on both datasets with key "ID_Category_Level_3"
- Next use "Group By" on columns "Name_Category_Level_3" and "Document_Date" to see the quantity of products bought at given date, which is essential for XYZ Analysis. Use the "Count" aggregation function.
- Next step is to connect the result from "Group By" to "XYZ Analysis" BLOX and feed the inputs field with appropriate columns. However, as a challenge, you have to figure out the columns for the "XYZ Analysis" BLOX
- We also have to specify the "Period" which is a look back window and "Time bucket" which is the period of repeated calculations for the given look back window, to get the same results as below choose 6 months and 1 months respectively
- Create an output "Chart XYZ" in the "XYZ Analysis" side bar and connect it to the "Display" BLOX. You can visualize the "ChartXYZ" output by selecting show/hide from the Output in the side bar of the "XYZ Analysis" BLOX.
- Connect "Start" BLOX to the datasets and click play button
Warning
Note that the order of the colums in the "Group By" BLOX does matter, hence, to make sure that it outputs the desired result, make sure that you first select "Name_Category_Level_3" and then "Document_Date". This way, the input is first grouped by "Name_Category_Level_3" and then by "Document_Date".Hint
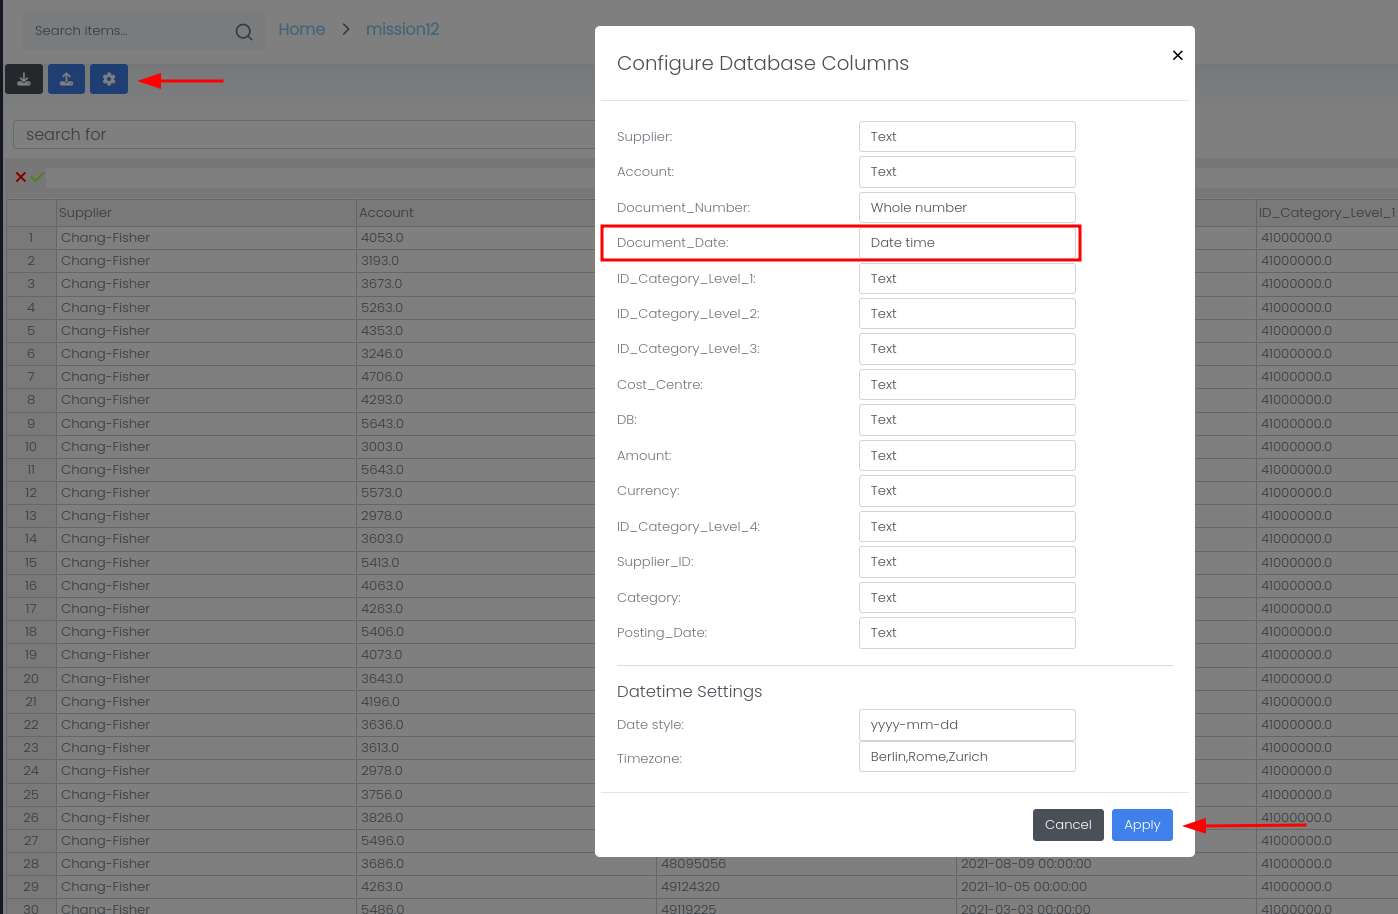
Use "Document_Date" as Timestamp, "Name_Category_Level_3" as Items and "size" as Quantity!Tip
By default, the thresholds for X, Y and Z categories are set to 1.2 and 2 and anything above that (coefficient of variation) respectively. If you want to change the thresholds simply type in the desired number in the "Threshold" box in the XYZ Analysis sidebar.
It is worth mentioning how products/services are classified in the XYZ analysis. Their classes are based on the coefficient of variation in demand, which means how stable is the demand for a given product/service. CoV is calculated by dividing the standard deviation by total demand of a given product/service.
Results and Summary
Now you will be provided with all the XYZ analysis information in the form of a graph. If you want to see more graphs describing the outcomes of the analysis, simply connect those ones from the BLOX sidebar that interest you most to another display chart.