Mission 12 - ABC Analysis
Estimated time for completing this mission: 20 mins
Learning Objective
Learning how to perform complex business analysis using LOGIBLOX business tools.
Scenario
ABC analysis is very useful for business analysis but takes a lot of time to prepare. With LOGIBLOX, creating comprehensive ABC analysis is made easy. All you need is a dataset containing SKUs column and profit/spending associated with it.
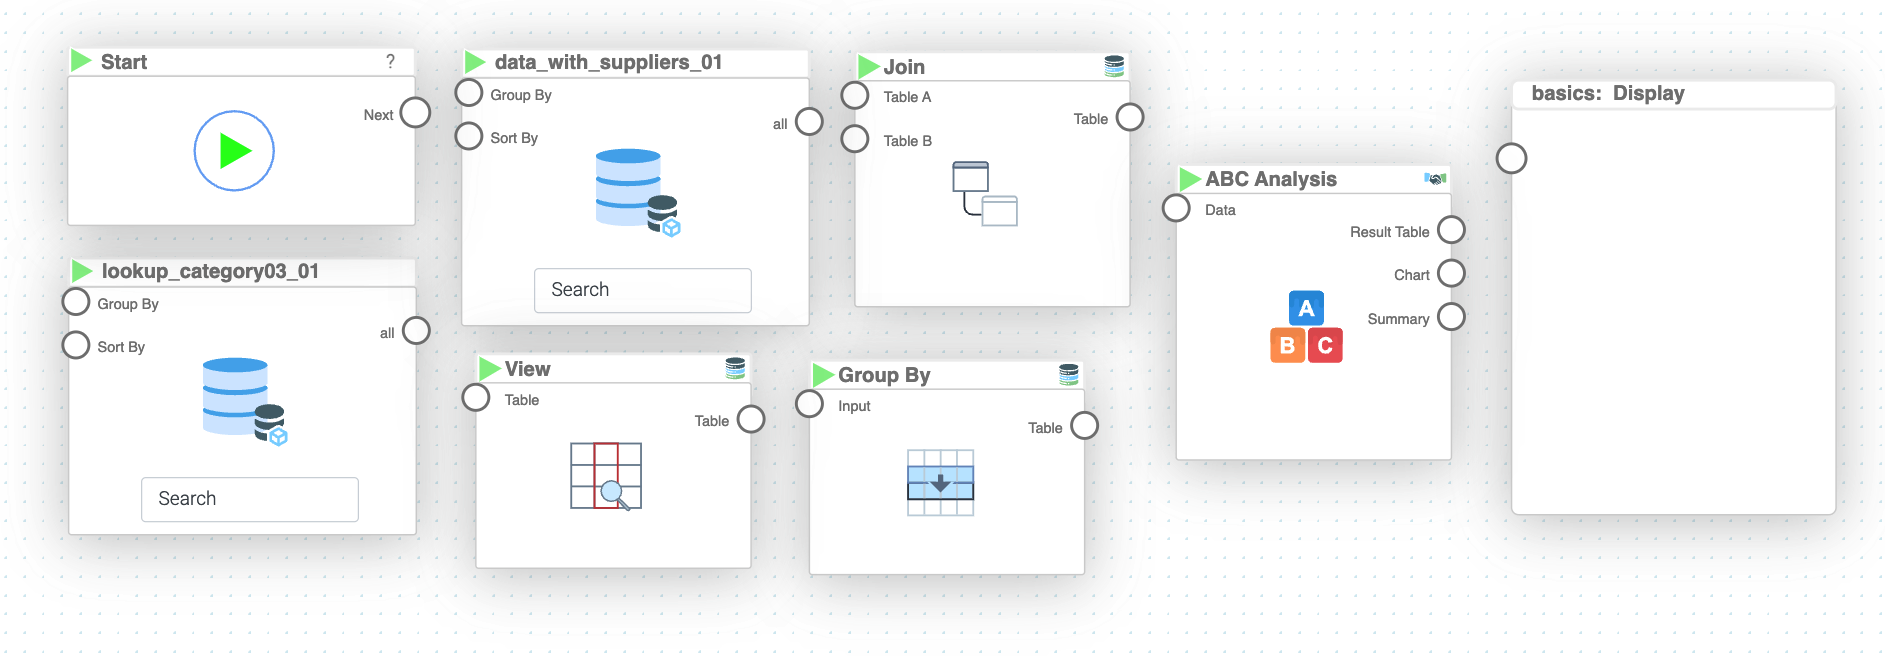
BLOX used in this mission:
- Basics/Start
- MyData/data_with_suppliers.xlsx
- MyData/lookup3.xlsx
- Database/Join
- Database/View
- Database/Group By
- Business/ABC Analysis
- Basics/Display
Data
Dataset with lookups: lookup3.xlsx
In this mission we will use the prepared dataset from the previous section.
If you can not create it, here is a link for the dataset data_with_suppliers.xlsx
Steps
Please refer to the Navigation Guide to perform the steps below
- In the Flow Builder, drag-and-drop the appropriate dataset from the "MyData" section
- Link the "Start" BLOX to both "MyData" BLOX
- Now, perform a left join operation on "data_with_suppliers" and "lookup3" on column "ID_Category_Level_3" using "Join" BLOX
- Next, create a view with only necessary columns i.e. "Name_Category_Level_3" and "Amount"
- Then we use the "Group By" BLOX to perform sum aggregation on "Name_Category_Level_3" and connect the "Result" table to the "ABC Analysis" BLOX
- In the "ABC Analysis", specify Item as "Name_Category_Level_3" and Numeric as "Amount". Because we have to specify the column with IDs/names of products/services and numerical value associated with them
- In order to display the chart from ABC analysis we have to connect the proper output, namely "Chart" which can be selected from output tab in the side bar of ABC analysis
- Now we can connect the "Chart" output to the display BLOX
- Press play, the result should be displayed on the "Display" BLOX
Tip
By default the thresholds for A, B and C categories are set to 80%, 15% and 5% of cumulative numerical value respectively. If you want to change the thresholds simply write desired number in the "Threshold" box in ABC Analysis sidebar e.g. 0.7 in "Threshold A" for 70%
Tip
If you hover over the outline of the graph in the "Display" BLOX information about individual product categories information!
Results and Summary
Now you will be provided with all the ABC analysis information in form of a graph. If you want to see the result table, containing detailed information, connect "Summary" output from "ABC" to "Display" BLOX or double click on the "ABC" BLOX after running the logic and select the tab containing the "ABC" chart.

