Mission 10: Data Quality
Learning Objective
Learn how to assess the quality of your data through comprehensive metrics and understand what makes data high quality.
Dataset
Download the required dataset: new_table_cars.xlsx
Step-by-Step Instructions
1. Open Your Dataset
First, open the data you want to analyze.
2. Access Analytics
Click on the analytics button to access data quality tools.

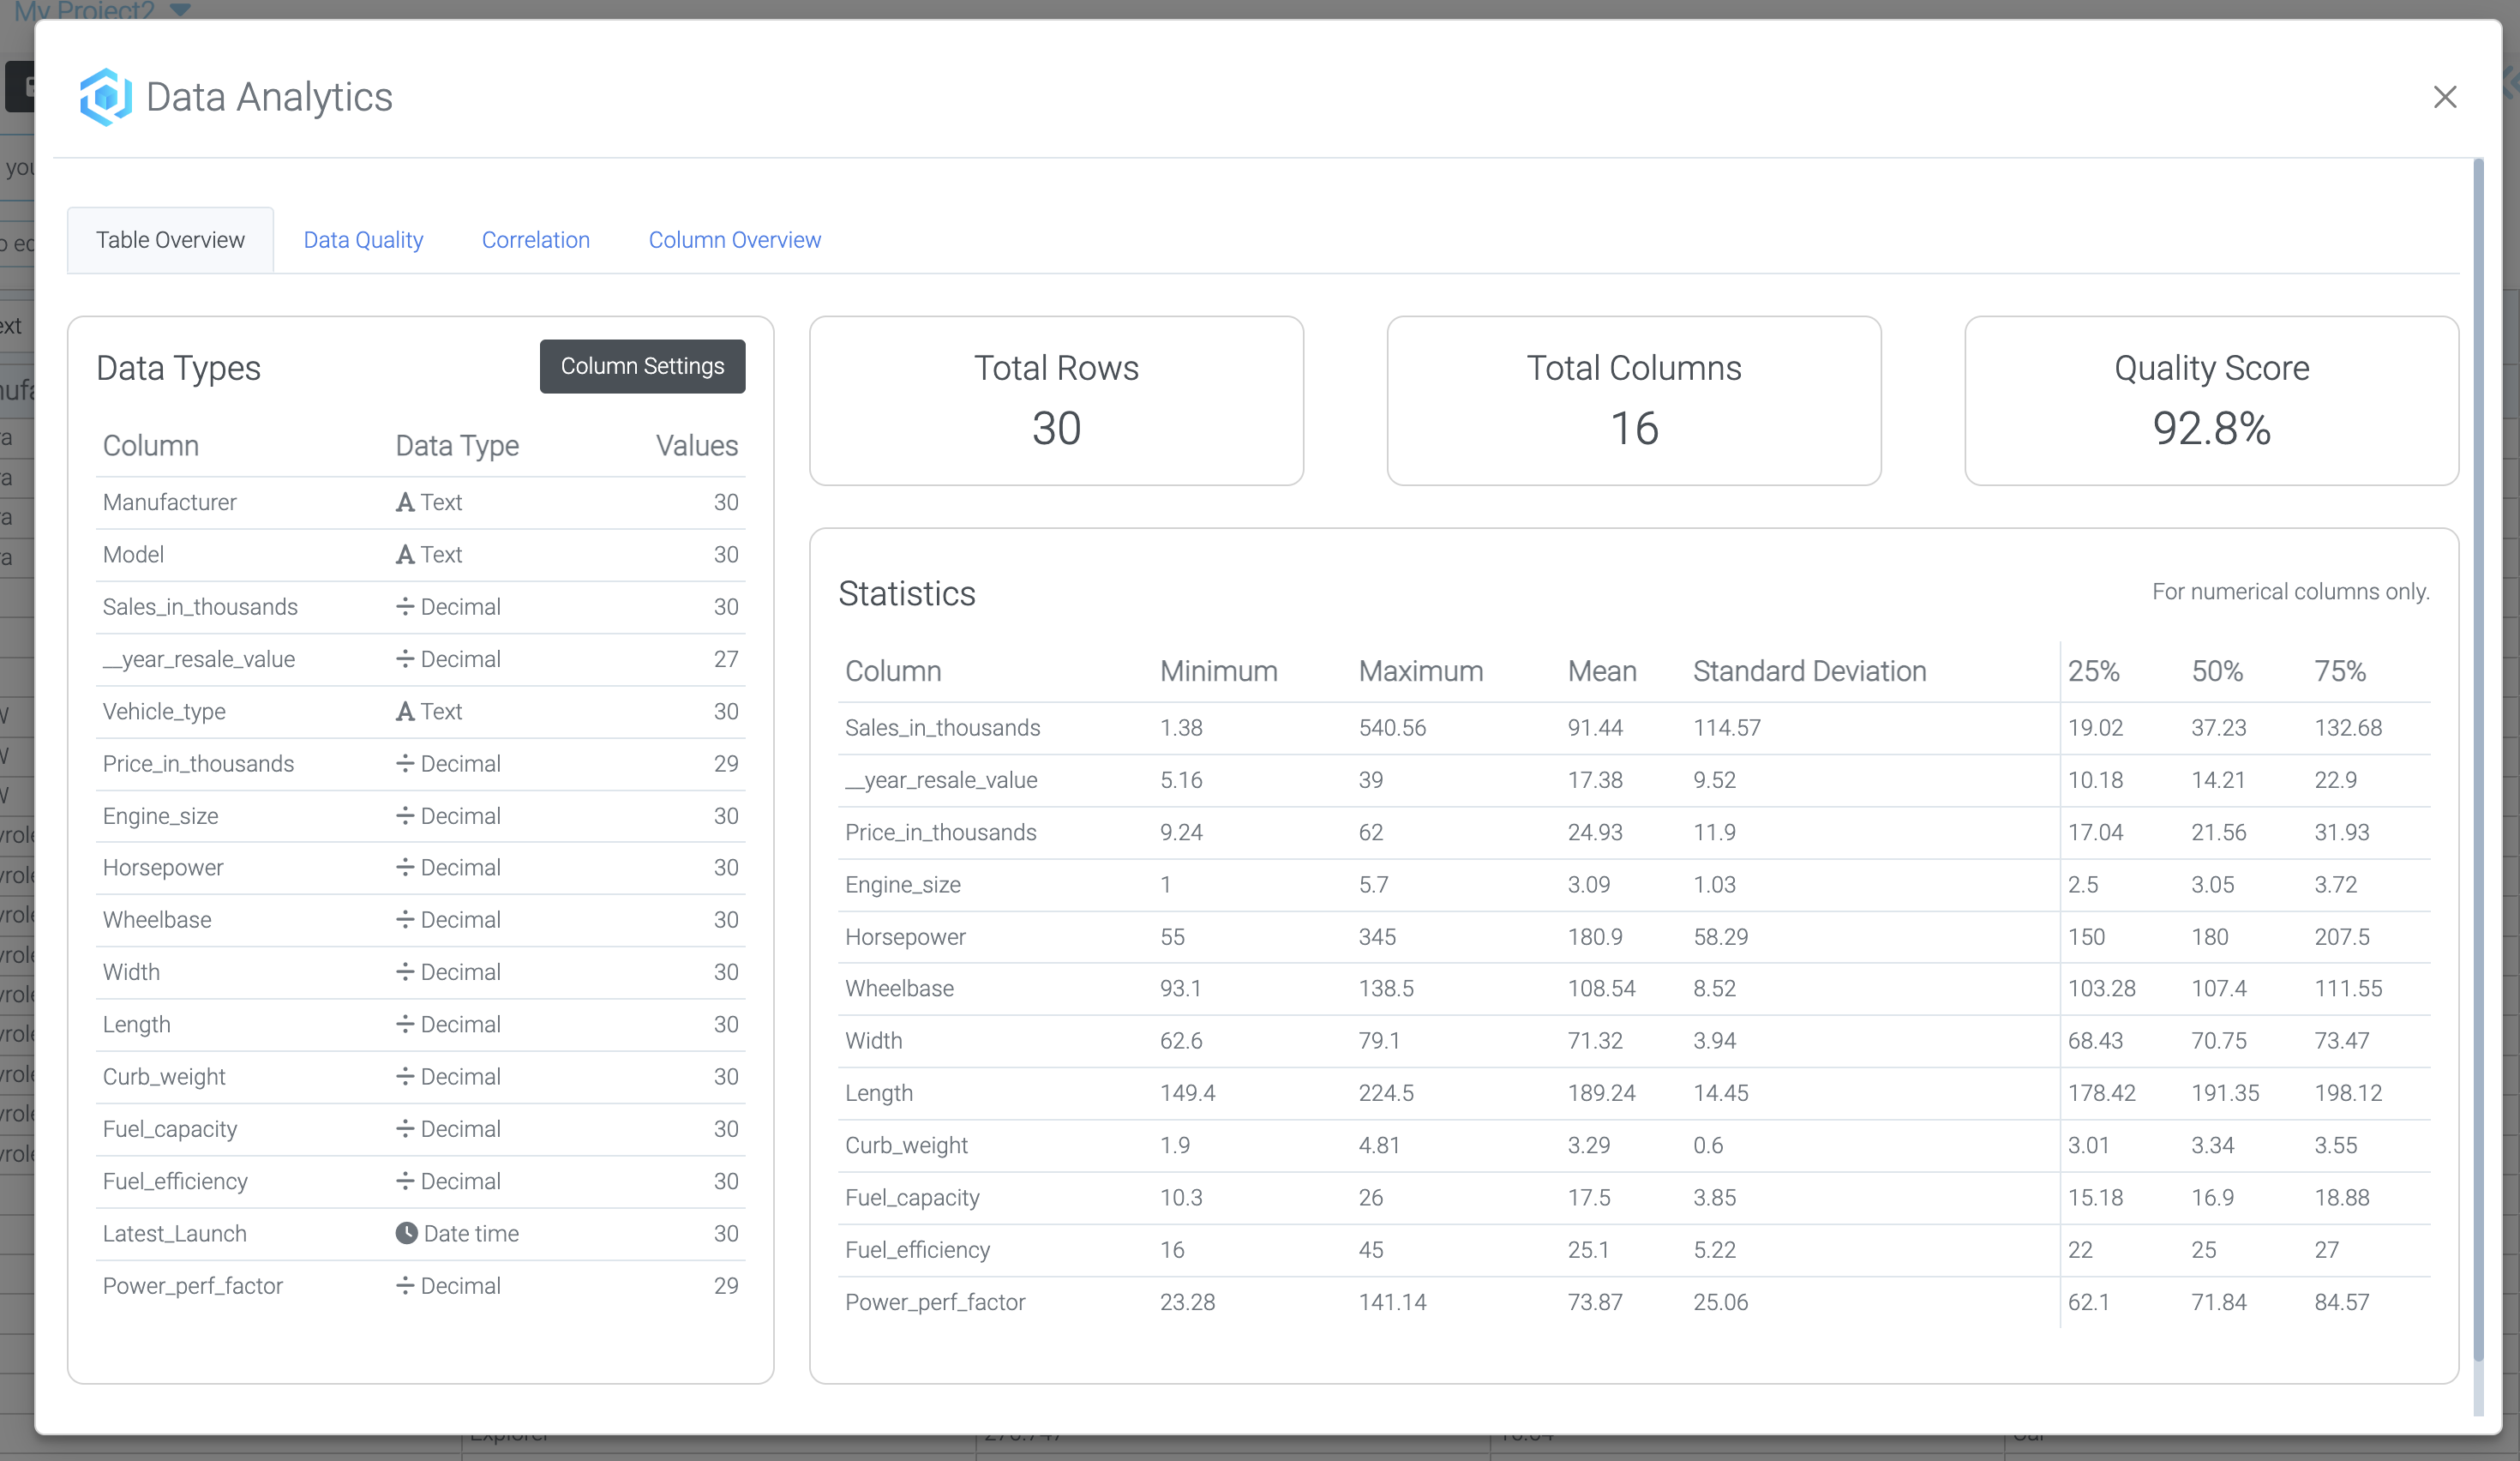
3. View Table Overview
After clicking analytics, you'll see the table overview.
4. Navigate to Data Quality
Click "Data Quality" in the top menu to view quality metrics.
Data Quality Metrics
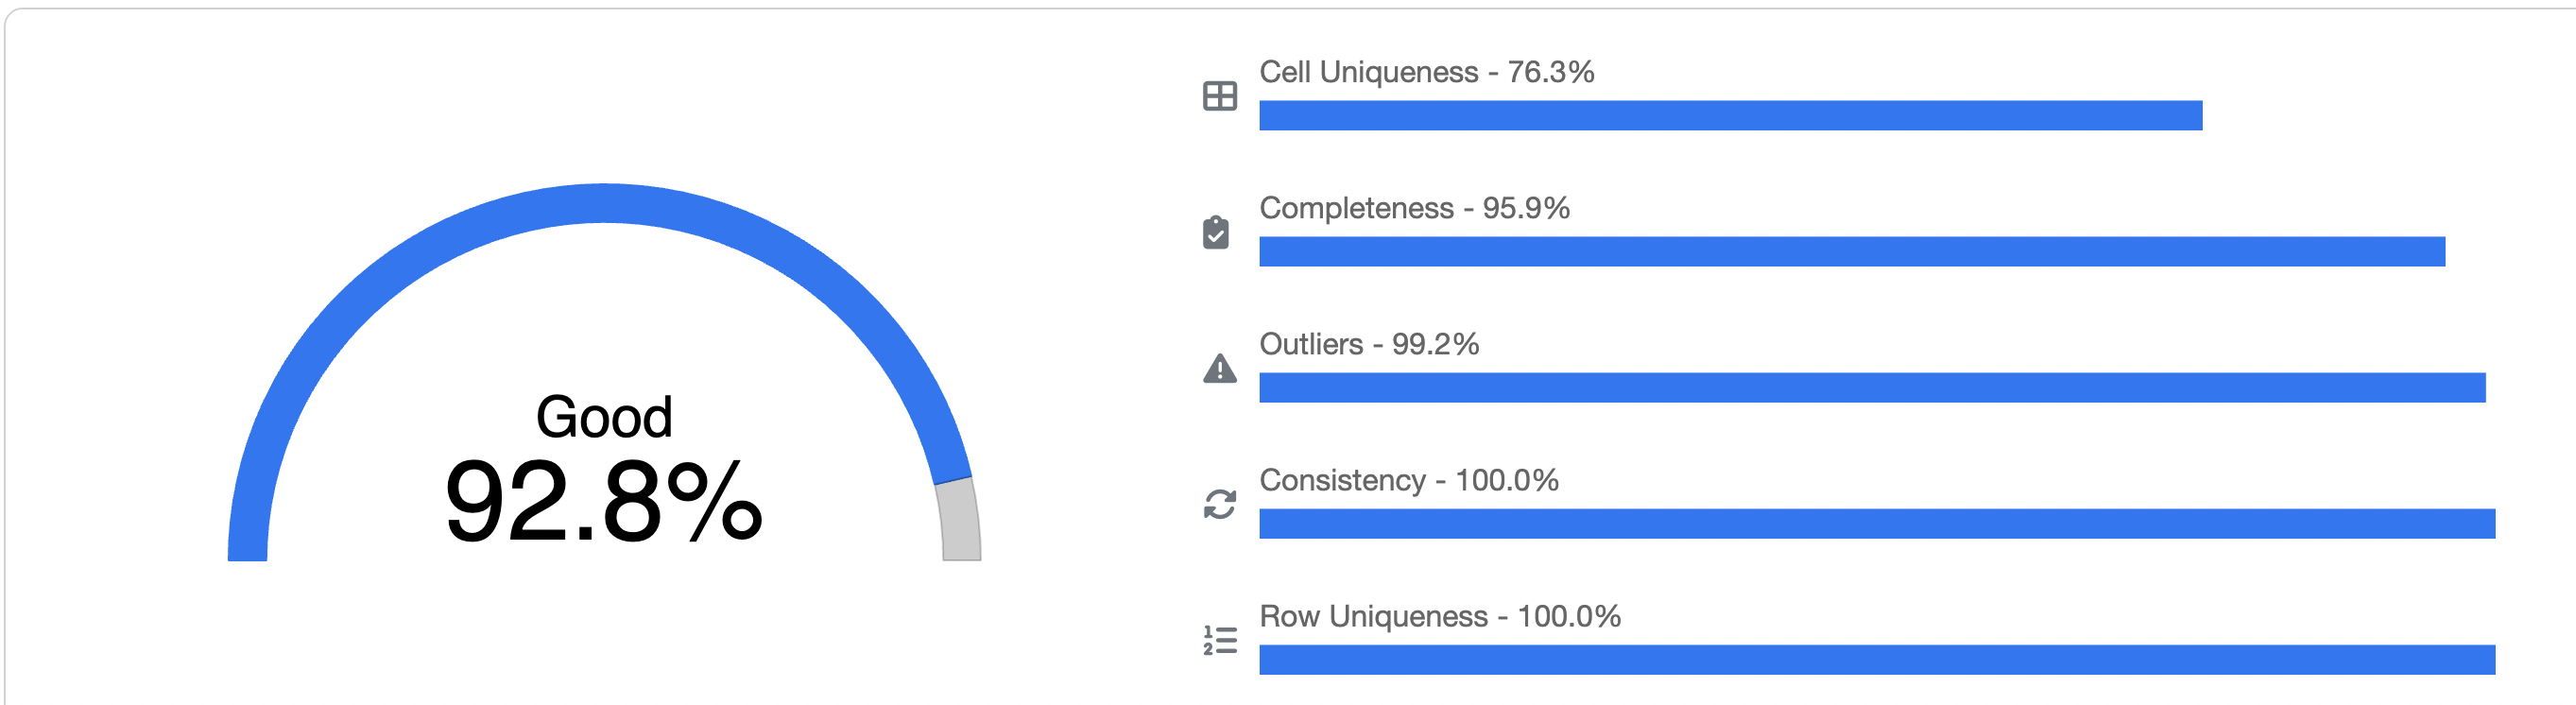
Understanding the Metrics
- Consistency - How consistent is the data? Are there columns that mix different data types?
- Completeness - How complete is the data? Are there missing values?
- Outliers - Are there many outliers in the data?
- Uniqueness - Is there redundancy in the data?
- Total - A combined score providing an overall quality overview
Note
For each metric, a higher score indicates better data quality.
Data Cleaning Options
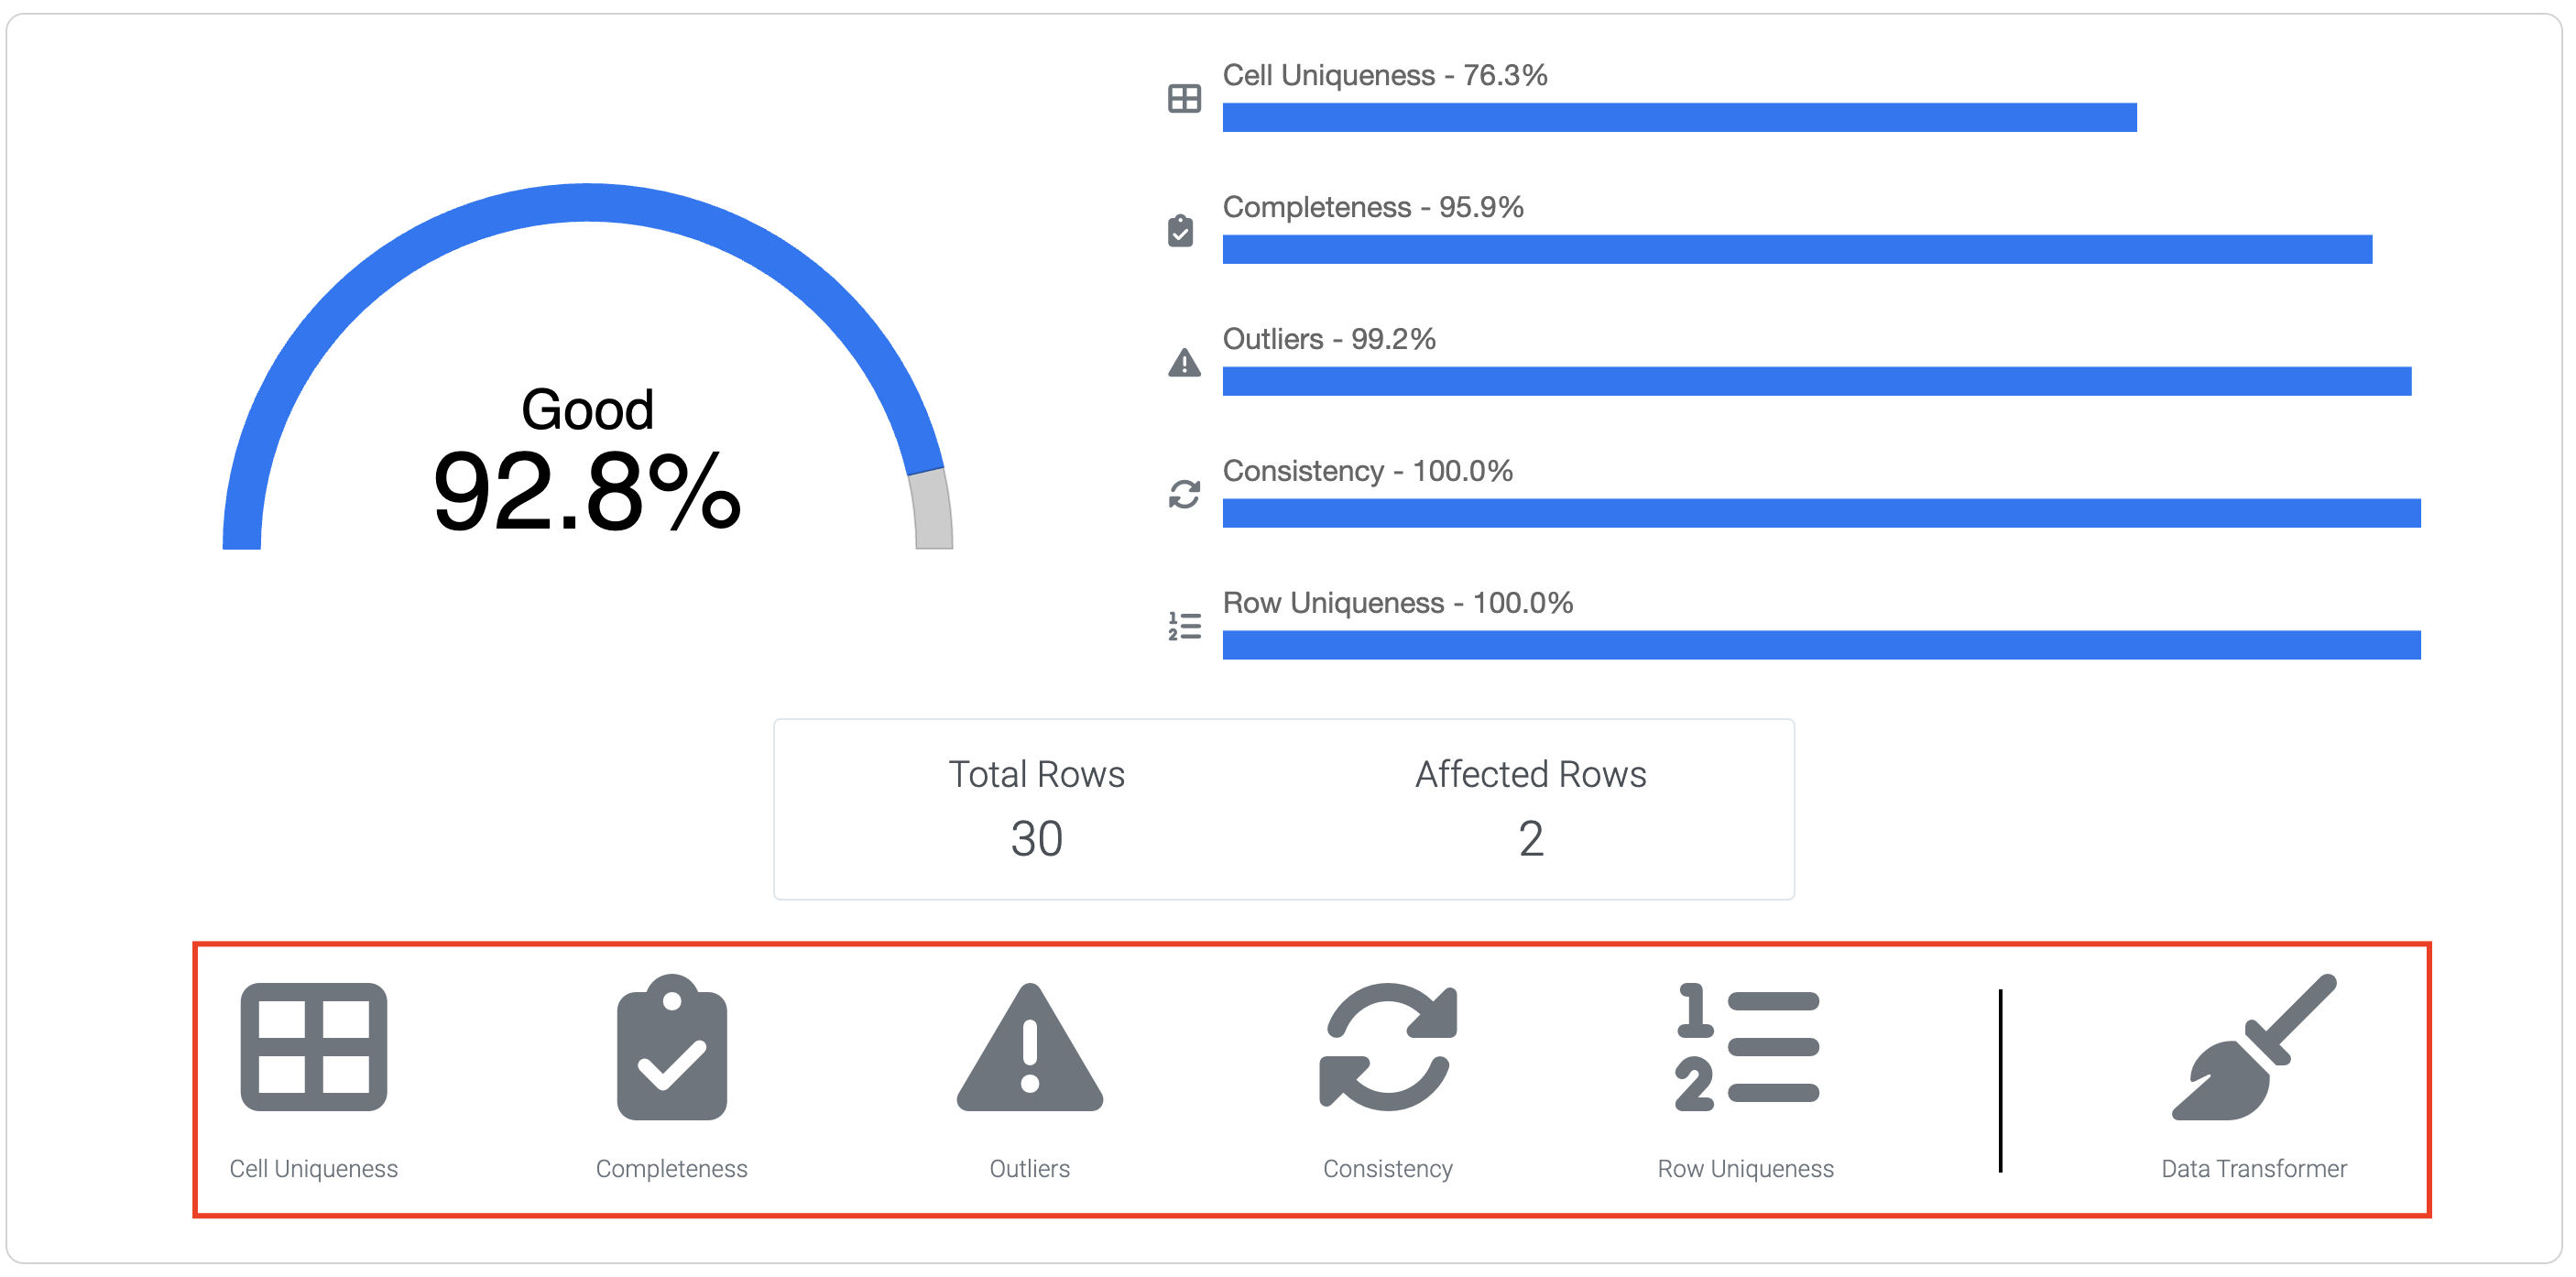
The data transformer is a powerful tool that helps you improve data quality and get the most out of your datasets.
Quality Score History
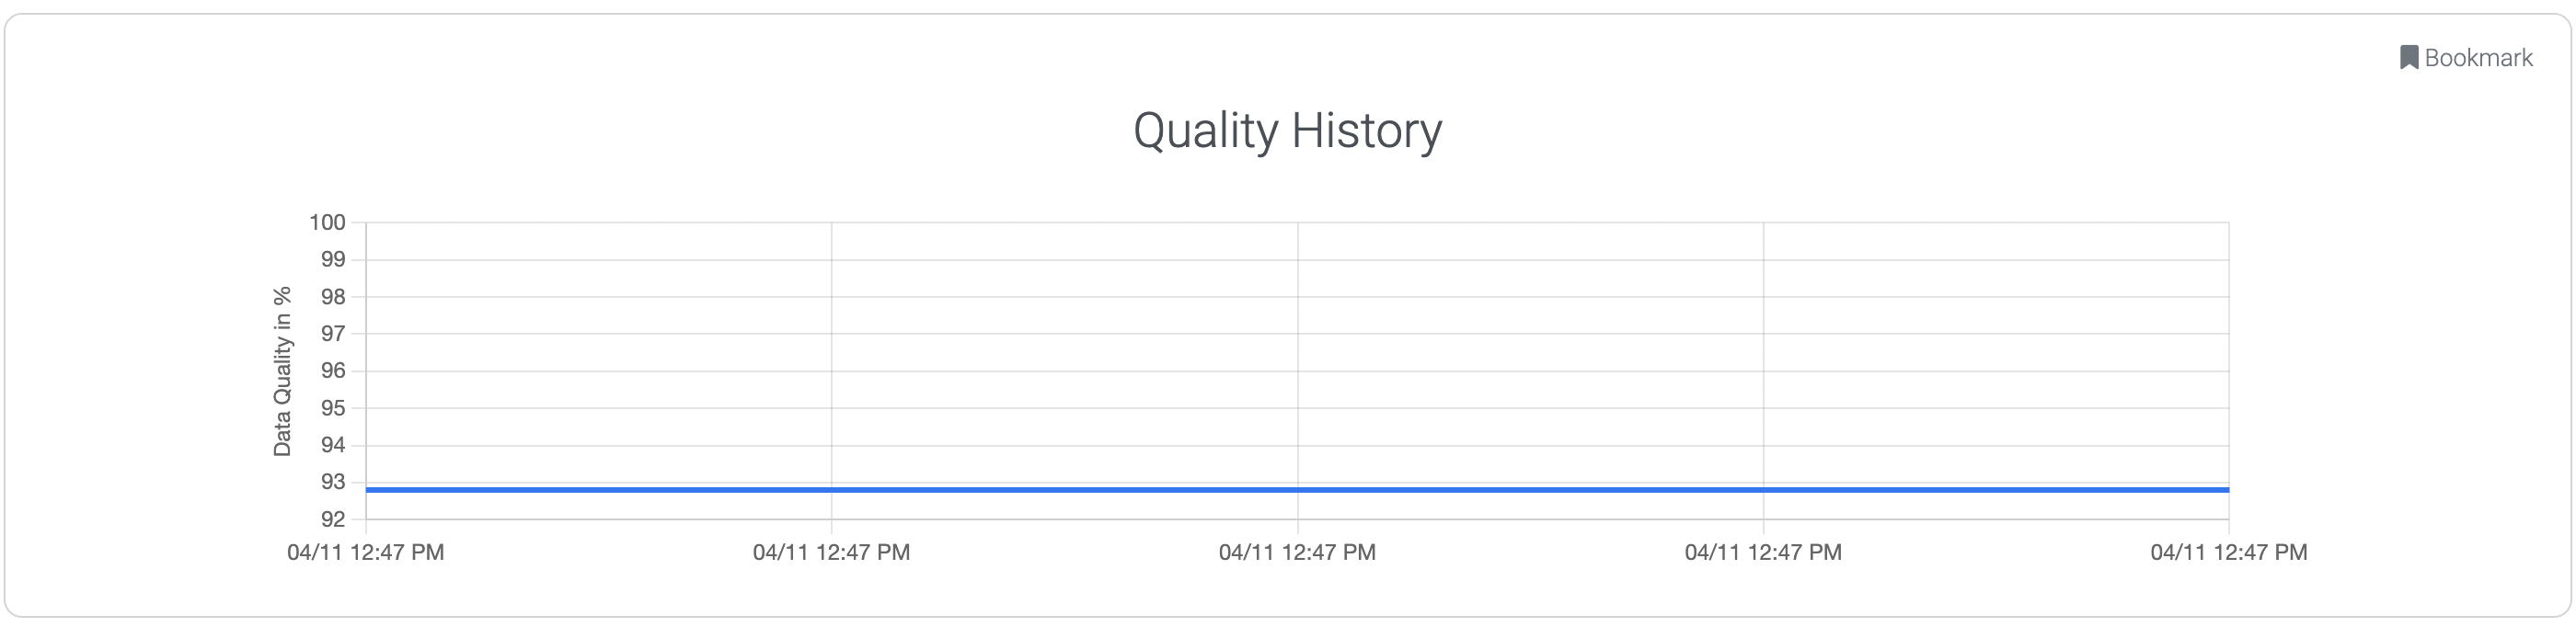
Track how your data quality improves as you clean and refine your datasets.
Best Practices
- Regular monitoring - Check data quality metrics regularly
- Address completeness first - Missing values often have the biggest impact
- Review consistency - Ensure data types are appropriate for each column
- Handle outliers carefully - Understand if they're errors or valid extreme values
- Eliminate redundancy - Remove duplicate rows to improve uniqueness
Summary
You've successfully learned how to:
✓ Access the data quality analytics dashboard
✓ Understand key data quality metrics
✓ Interpret consistency, completeness, outliers, and uniqueness scores
✓ Use cleaning options to improve data quality
✓ Track quality improvements over time